List of strategies 1
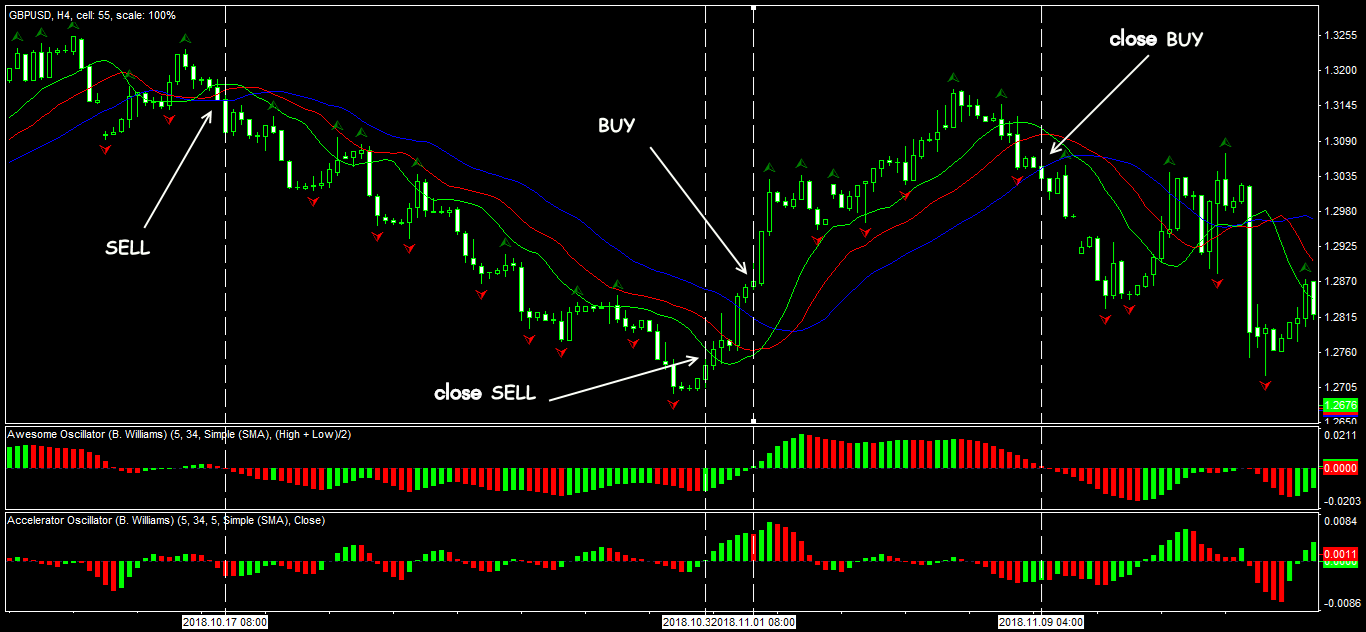
Strategy 1: The Profitunity trading method (Trading Chaos by Bill Williams)
Indicators: Fractals; Alligator; Awesome Oscillator; Accelerator Oscillator with standard parameters.
Special conditions: the necessary signals (sequentially) are Fractals + Alligator + Accelerator Oscillator; an additional signal is Awesome Oscillator.
BUY: fractal down; a breakdown of the blue Alligator line from bottom to top; AC is in the green zone; entry after the AO histogram crosses the centerline from the bottom up.
SELL: fractal up; a breakdown of the blue Alligator line from top to bottom; AC is in the red zone; entry after the AO histogram crosses the centerline from top to bottom.
Exit or reversal: reverse breakdown of the green Alligator line and reversal of the AC and AO histograms.
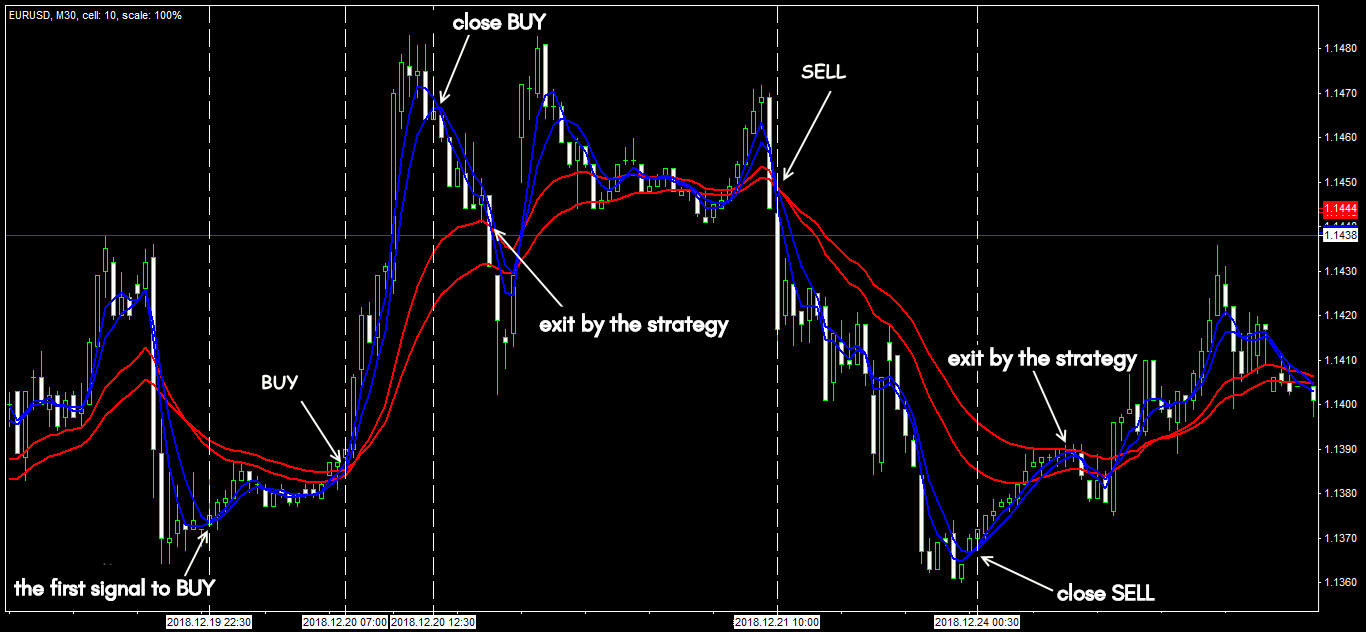
Strategy 2: The Sidus Method
Indicators: EMA (18), EMA (28) - red channel; WMA (5), WMA (8) - blue channel.
Special conditions: the analysis timeframe is at least M30, the transaction support timeframe is at least H1.
BUY: WMA (5) and WMA (8) cross the red channel from bottom to top; a preliminary crossing of the WMA (5) and the WMA (8) lines amplifies the buy signal.
SELL: WMA (5) and WMA (8) cross the red channel from top to bottom; a similar intersection of WMA (5) and WMA (8) lines amplifies the sell signal.
Exit: after the intersection of the blue lines, or after the breakdown of the red channel in the opposite direction.
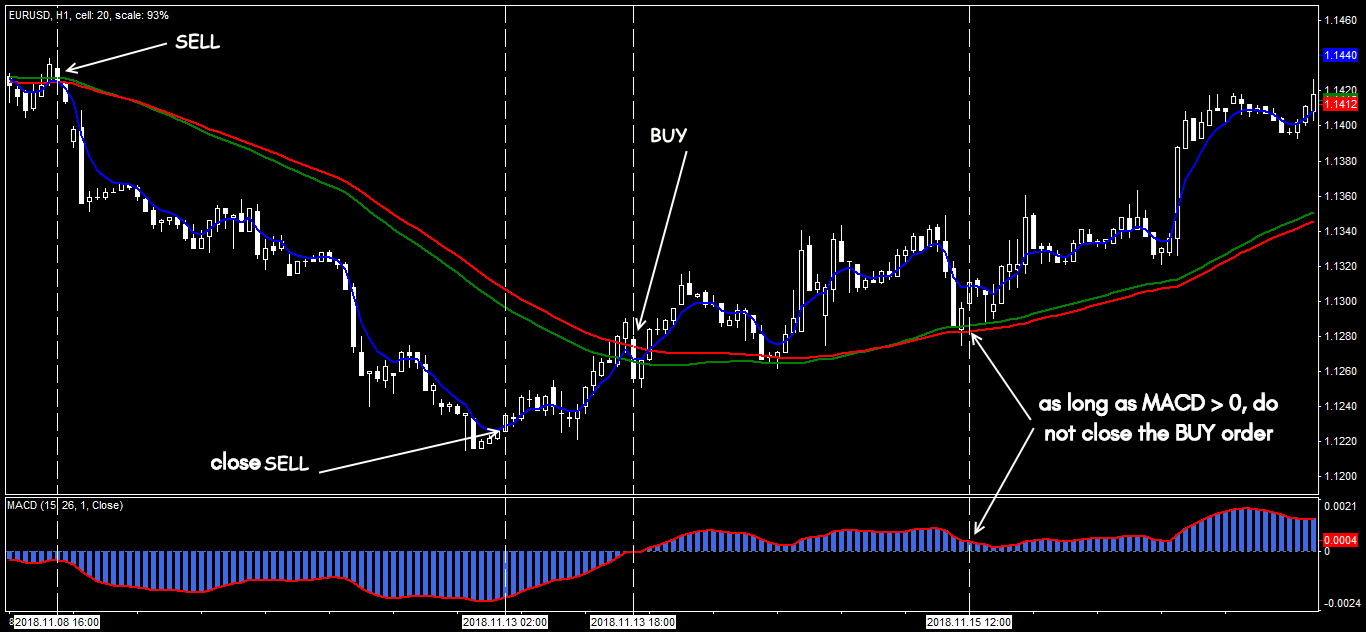
Strategy 3: The Puria Method
Indicators: MA (85; LinearWeighted; Low) is red; MA (75; LinearWeighted; Low) is green; EMA (5; Close) is blue; MACD (15; 26; 1; Close).
Special conditions: The timeframe is M30-H1. If the price has broken through both long averages, but the fast EMA (5) - only through one, then, regardless of the MACD signal, the deal is not opened.
BUY: EMA (5) crosses MA (75) and MA (85) from the bottom up, and at least one MACD bar is closed above the zero line.
SELL: EMA (5) crosses MA (75) and MA (85) from top to bottom, and at least one MACD bar is closed below the balance line.
Exit: either at the turn of the MACD histogram or at the reverse intersection of the MA (75) and MA (85) lines by the EMA (5).
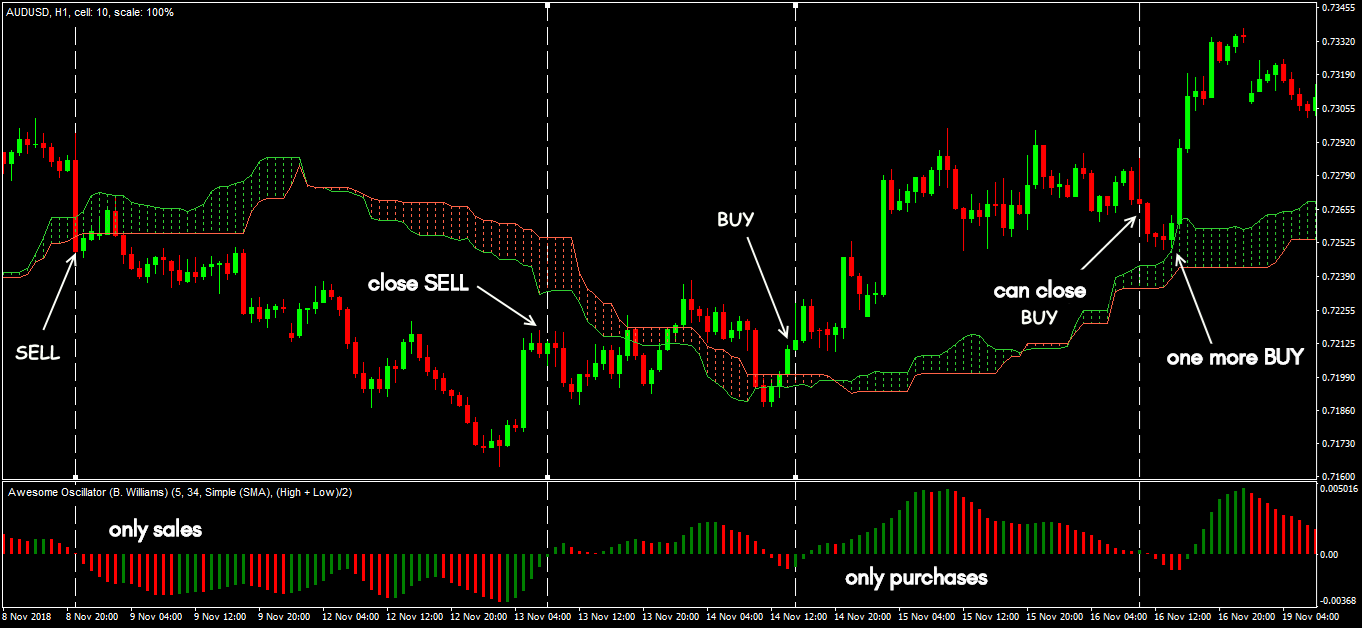
Strategy 4: The Kumo Breakout
Indicators: Ichimoku (8; 29; 34) - only Kumo zone (Tenkan-Sen, Kijun-Sen and Chinkou Span are disabled); Awesome Oscillator with standard parameters.
Special conditions: the timeframe for searching for an entry point is M15, for tracking a transaction - H1 and higher.
BUY: a breakdown of the upper boundary of Kumo and the reversal of the AO histogram from the bottom up.
SELL: a breakdown of the lower border of Kumo and the reversal of the AO histogram from top to bottom.
Exit: backward breakdown of the zero line by the AO histogram.
Strategy 5: The Momentum Elder
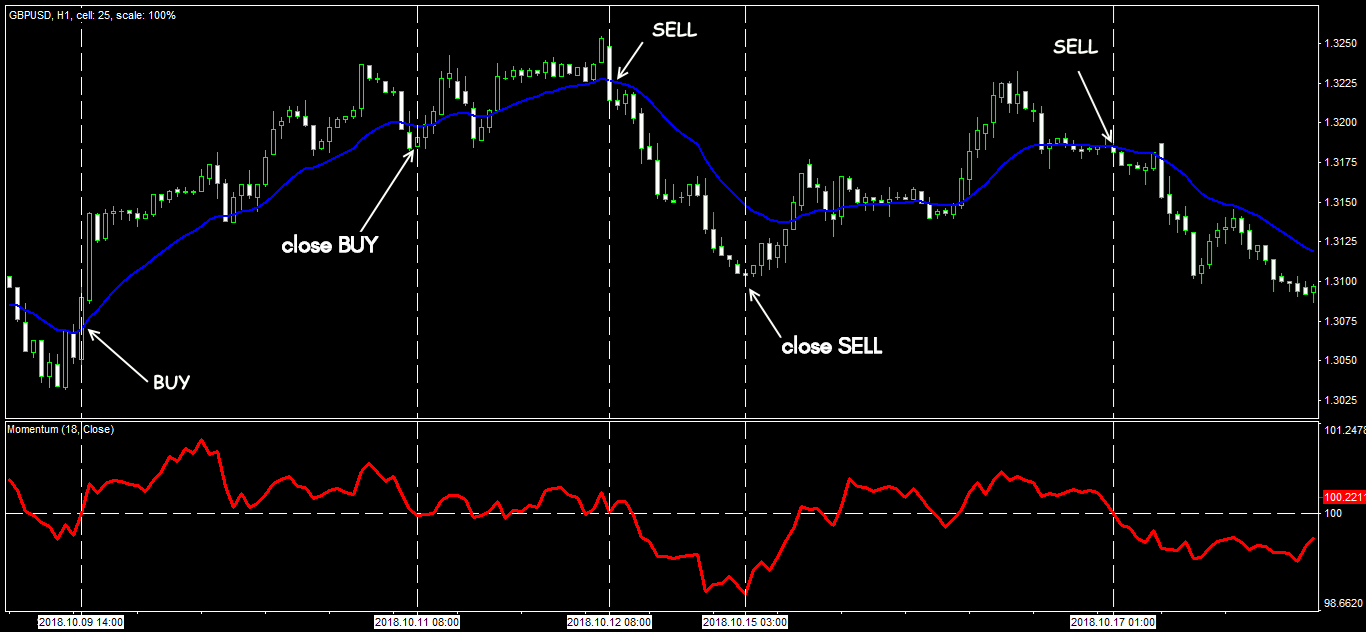
Indicators: EMA (19; close); Momentum (18; close; 100).
Special conditions: the timeframe is not lower than H1.
BUY: closing above EMA (19), and Momentum crosses the level of 100 from the bottom up - the entrance is at the next bar.
SELL: closing below EMA (19), and Momentum crosses the level of 100 from top to bottom.
Exit: the turn of the Momentum line or the cross of the level of 100.
Strategy 6: The Holy Grail
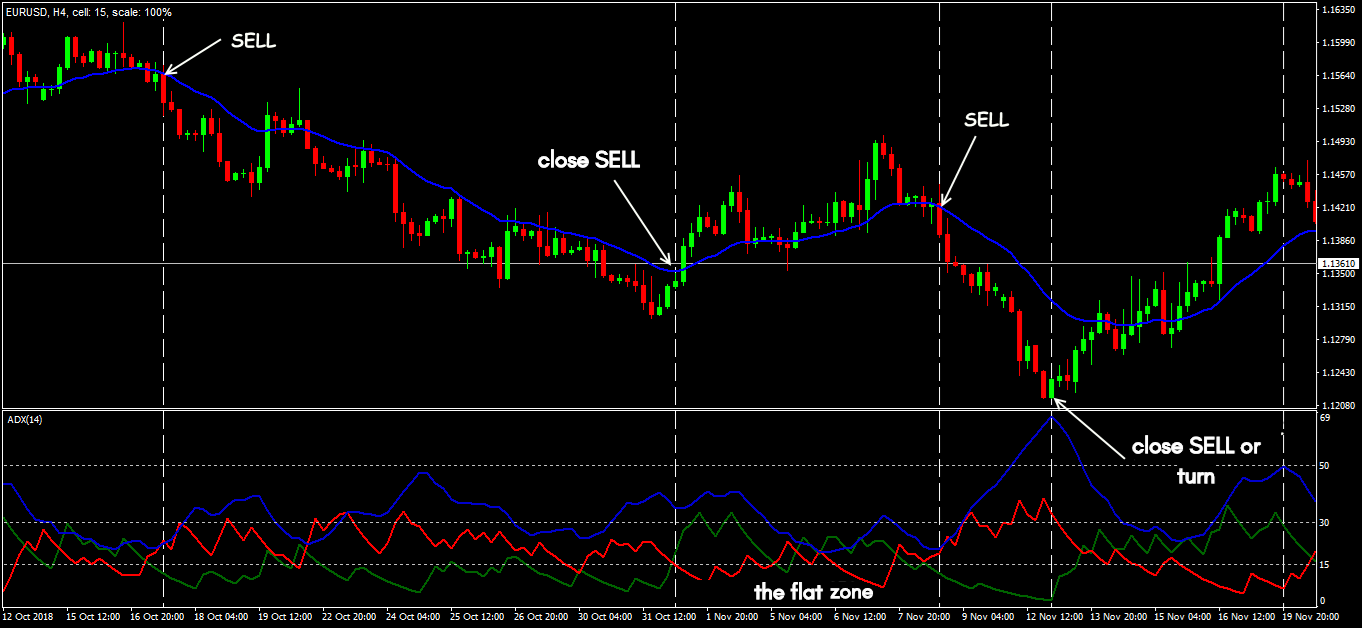
Indicators: EMA (20; close); ADX (14) with levels of 50, 30, 15.
Special conditions: the analysis and entry timeframe is at least H4, for position tracking - D1. If the ADX lines are in the zone of 15 - flat, we are not entering the market.
BUY: Up-trend by EMA; ADX rises above 30. A breakdown of EMA in the opposite direction (from top to bottom) with a rollback. The entrance is at the next bar.
SELL: bearish trend by EMA; ADX grows above 30. A breakdown of EMA from the bottom up with a rollback. The entrance is at the next bar.
Exit: the reversal of the ADX line down from the upper zone.
Strategy 7: The MACD Profitunity
Indicators: MACD (34; 89; 9), Awesome Oscillator and Fractals with default parameters.
Special conditions: the timeframe is not lower than H1.
BUY: fractal down; the MACD histogram is above the signal and center lines; a reversal to the green zone is on the AO histogram.
SELL: fractal up; the MACD histogram is below the signal and center lines; a reversal to the red zone is on the AO histogram.
Exit or reversal: reverse fractal or when the reversal signal appears on the AO and MACD indicators.
Strategy 8: The Outside Bar trading method
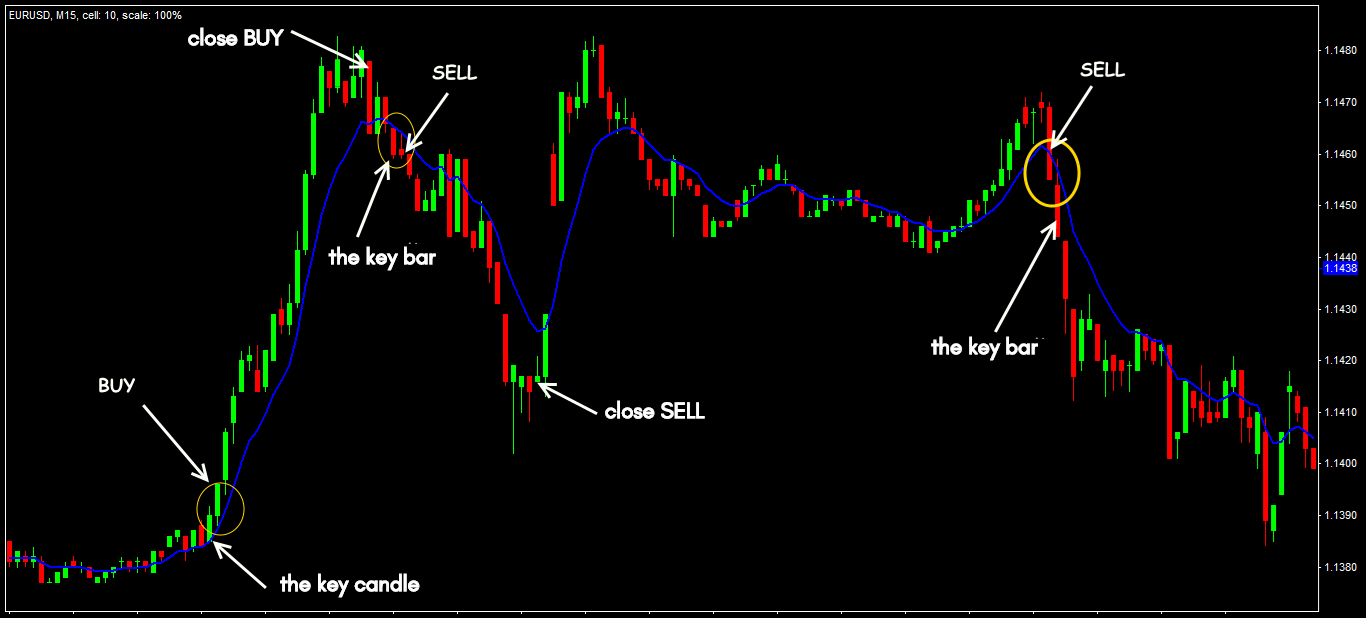
Indicators: EMA (9; close).
Special conditions: major currency pairs; the timeframe is M15; the body and shadows of the key candle do not touch the moving average line. We do not trade on the flat; a clear trend is required with an average line slope of more than 30⁰.
BUY: the key candle closes above the previous High price; the distance from the EMA line to the High price is at least 5-8 points. The entrance is at the next bar.
SELL: the key candle closes below the previous Low price; the distance from the EMA line to the Low price is at least 5-8 points. The entrance is at the next bar.
Exit: candlestick reversal pattern.
Strategy 9: The Stochastic + Trend trading method
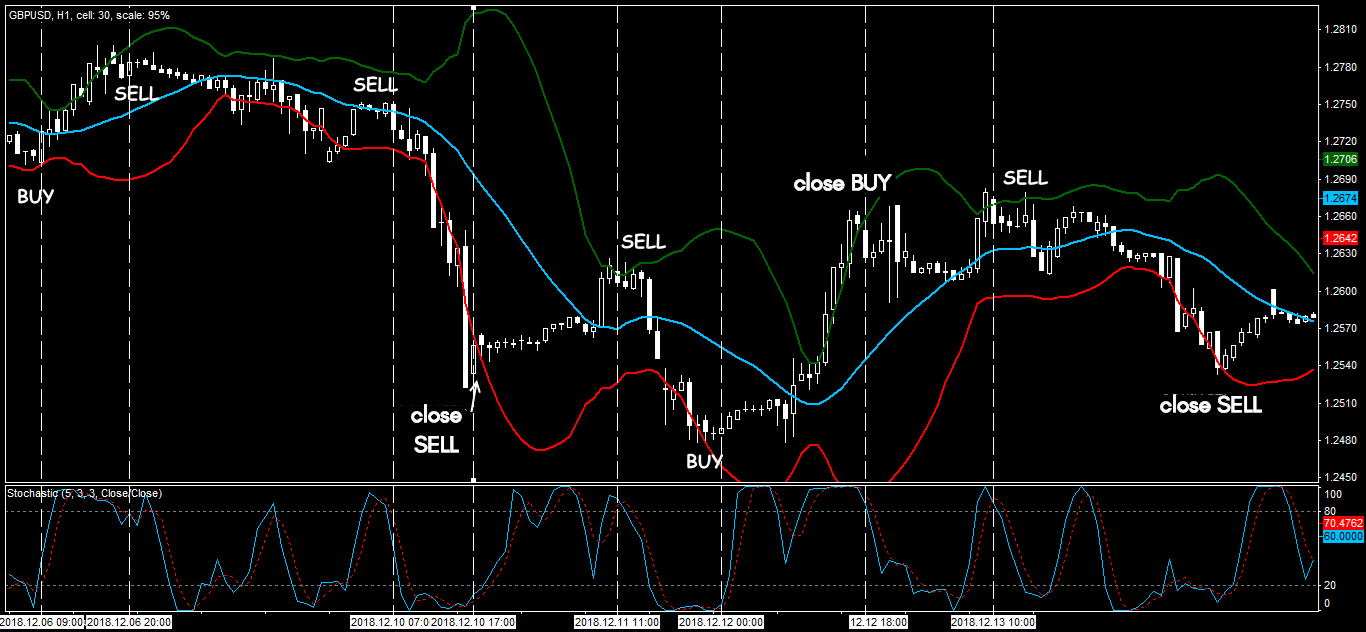
Indicators: Bollinger Bands (20; 2; 0; close) or any channel indicator; Stochastic (5; 3; 3).
Special conditions: the timeframe is not lower than M30; flat periods; we do not trade before and after the news release.
BUY: the price is turning up from the lower border of the channel, the fast oscillator line crosses the slow one from the bottom up in the oversold zone. The entrance is at the next bar after the crossing of the Stochastic lines.
SELL: the price is turning down from the upper border of the channel, the fast oscillator line crosses the slow one from top to bottom in the overbought zone. The entrance is at the next bar after the crossing of the Stochastic lines.
Exit or reversal: reverse signal.
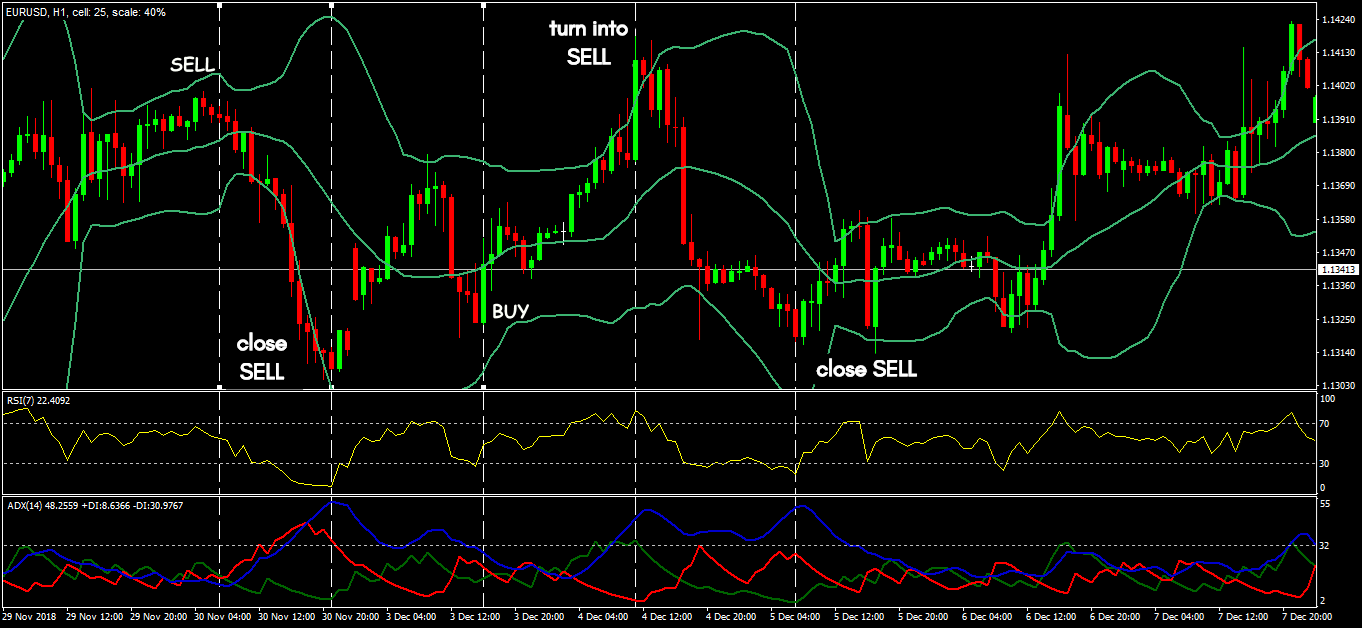
Strategy 10: The Universal Kit
Indicators: Bollinger Bands (20; 2; 0; close); RSI (7); ADX (14) with the level of 32.
Special conditions: the timeframe is not lower than M30; the trailing is recommended. We do not trade during the periods of flat and speculation.
BUY: the price is turning up in the zone of the lower (or middle) Bollinger border; RSI is in the oversold zone, ADX is no more than 32.
SELL: the price is turning down from the upper (or middle) border; RSI is in the overbought zone, ADX is no more than 32.
Exit or reversal: reverse signal.
Try It Yourself
As you can see, backtesting is quite simple activity in case if you have the right backtesting tools.
The testing of this strategy was arranged in Forex Tester with the historical data that comes along with the program.
To check this (or any other) strategy’s performance you can download Forex Tester for free.
In addition, you will receive 23 years of free historical data (easily downloadable straight from the software).
