List of strategies 2
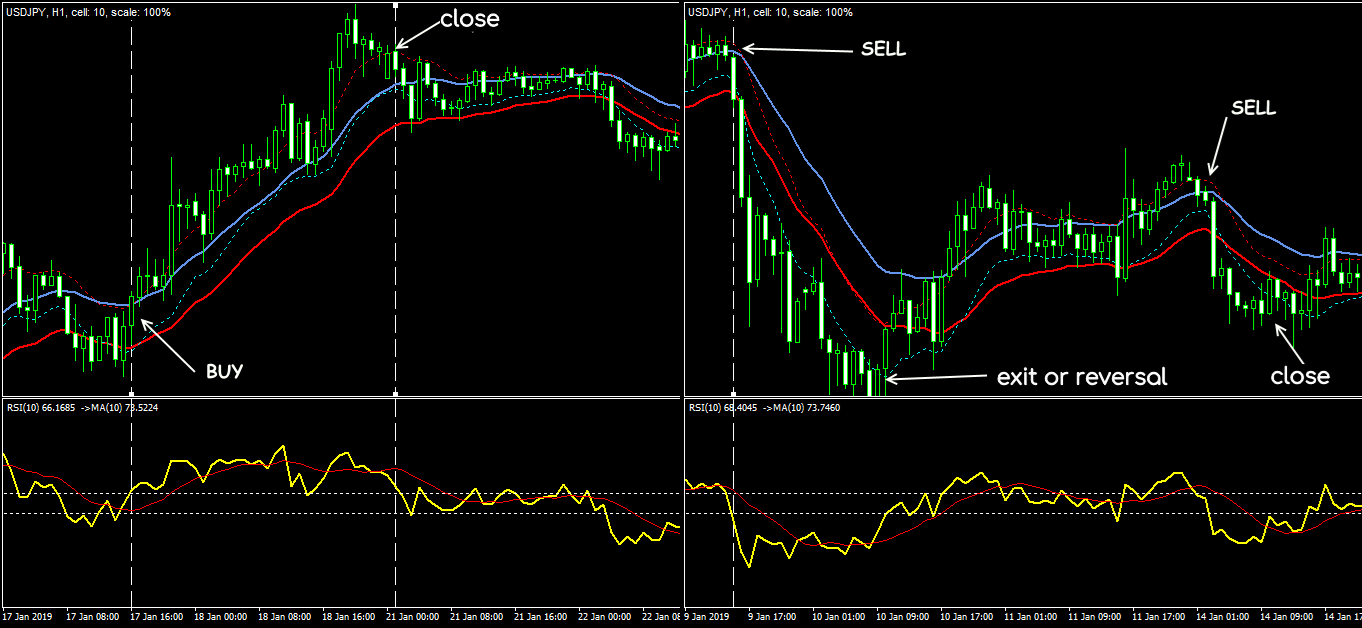
Strategy 11: Over 80
Indicators: blue channel - EMA (20; 0; high) solid and EMA (10; 0; low) dotted lines; red - EMA (20; 0; low) solid and EMA (10; 0; high) dotted lines. RSI (10; 0; close; 55; 45) and SMA (10; 0; Previous Indicator's Data).
Special conditions: assets with stable volatility; TF is not lower than H1; Stop Loss is dynamic along the MA line.
BUY: RSI is above 55 and its MA; the bar is closed below the blue MA. Stop Loss is 10-15 points lower than the red MA.
SELL: RSI is below 45 and its MA bar is closed above the red MA. Stop Loss is 10-15 points higher than the blue MA.
Exit: close at the end of the day with a strong return signal.
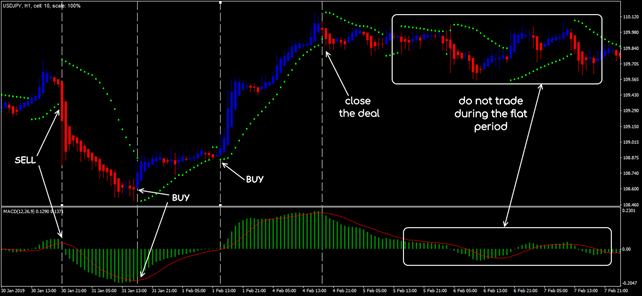
Strategy 12: Parabolic SAR + MACD
Indicators: Parabolic SAR (0,02; 0,2); MACD (12; 26; 9; close).
Special conditions: the currency pairs during a period of stable volatility; M30/H1/H4; the main one is MACD. The optional is PSAR; Stop Loss is 5-30 points for the min/max of the key bar.
BUY: the intersection of the line and the MACD histogram with a turn up; gap up on the PSAR line. Buy Stop is above max key bar.
SELL: the intersection of the line and the MACD histogram with a turn down; gap down on the PSAR. Sell Stop is below min key bar.
Exit: by Stop Loss or the appearance of a return signal.
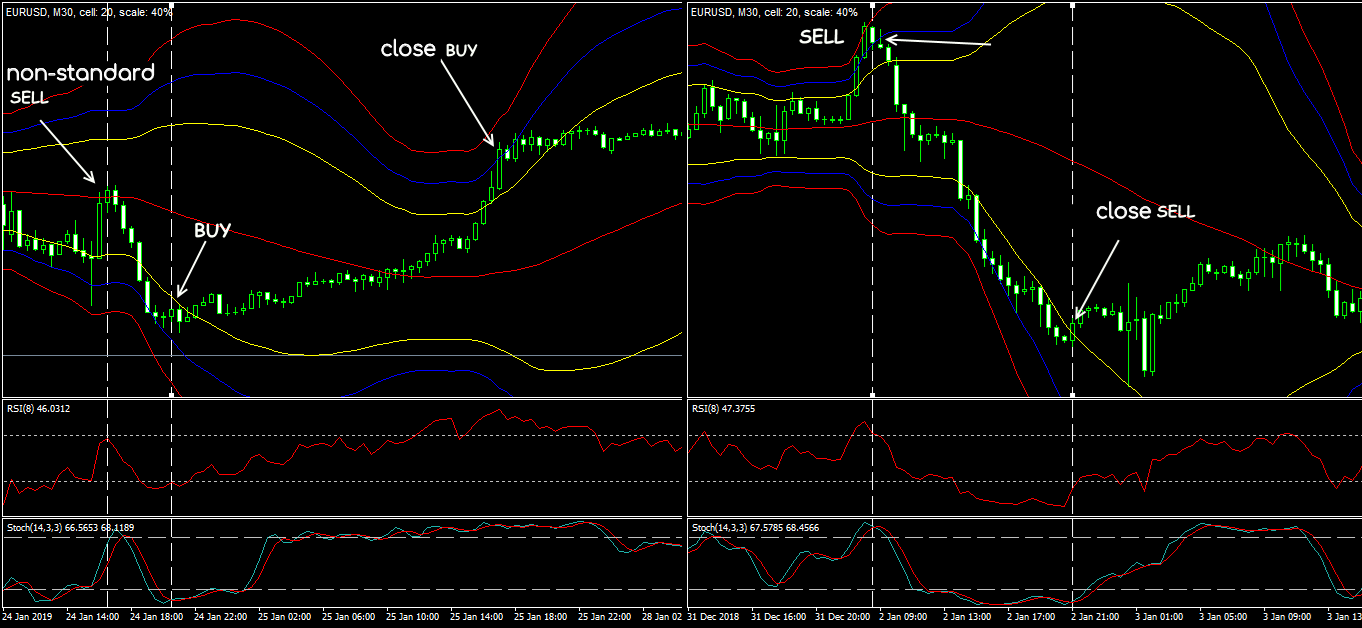
Strategy 13: Bollinger Bands Scalp
Indicators: Bollinger Bands (50; 0; 2; close) are yellow; BB (50; 0; 3; close) are blue; BB (50; 0; 4; close) are red; RSI (8; close); Stochastic (14; 3; 3; high/low; 20; 80).
Special conditions: TF is not lower than M30; entry on the next bar. Trailing is 10-15 points. Signals from the BB centerline - only with a large bandwidth.
BUY: the price breaks up the lower blue BB; RSI and Stochastic turn up from the oversold zone.
SELL: the price breaks down the upper blue BB; RSI and Stochastic turn down from the overbought zone.
Exit: For purchase: 1st signal is on a breakdown of the upper blue BB, 2nd - is on a breakdown of the upper yellow BB or Stop Loss. For sale: 1st signal is on a breakdown from the bottom up of the bottom blue BB, 2nd is on a breakdown of the bottom yellow BB or Stop Loss.
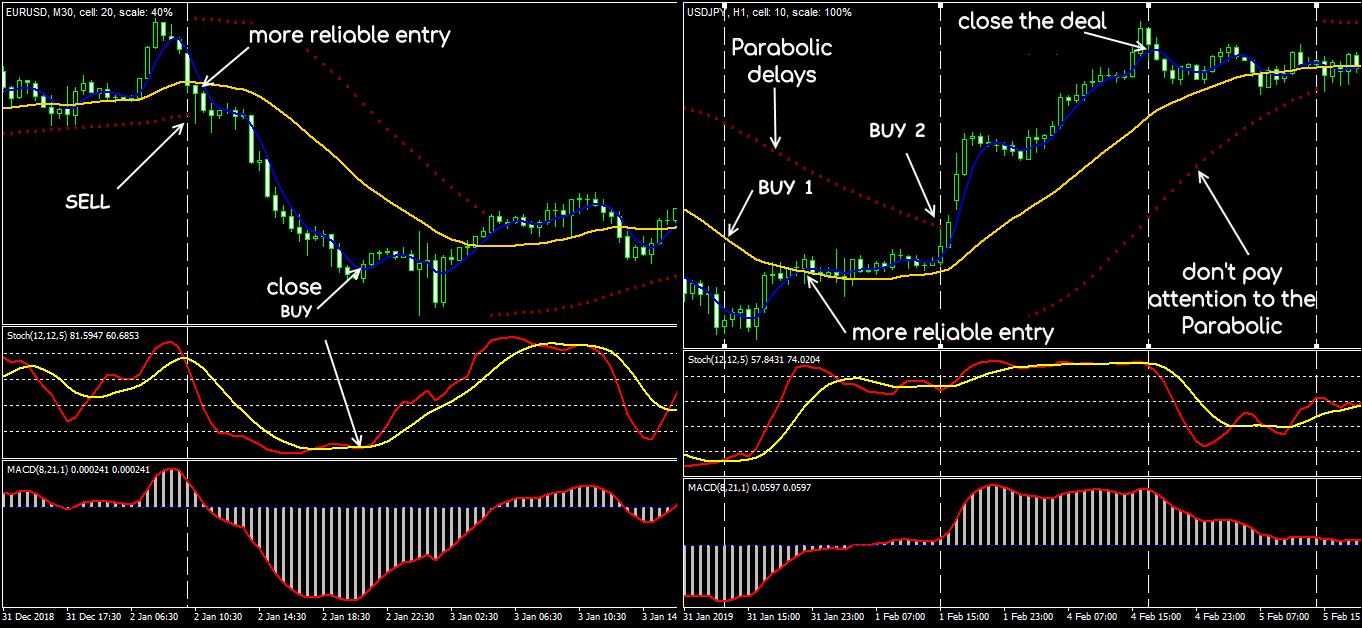
Strategy 14: Forex Smart
Indicators: Parabolic SAR (0,02; 0,2); MACD (8; 21; 1; close); LWMA (5; 0; Linear Weighted; HLC/3); LMA (36; 0; Linear Weighted; HLC/3); Stochastic (12; 12; 5; low/high; LWMA; 20, 40, 60, 80).
Special conditions: major currency pairs; TF is not lower than M30. Parabolic signal is late. Trailing Stop Loss is 10-15 points.
BUY: 1st signal is when Stochastic turns up below the level of 40; intersection of MA from the bottom up; a gap on the PSAR and a turn on the MACD up is an additional signal.
SELL: 1st is when Stochastic turns downward above the level of 60; intersection of MA from top to bottom; a gap on the PSAR and a turn on the MACD down.
Exit: by Stop Loss or reverse signal.
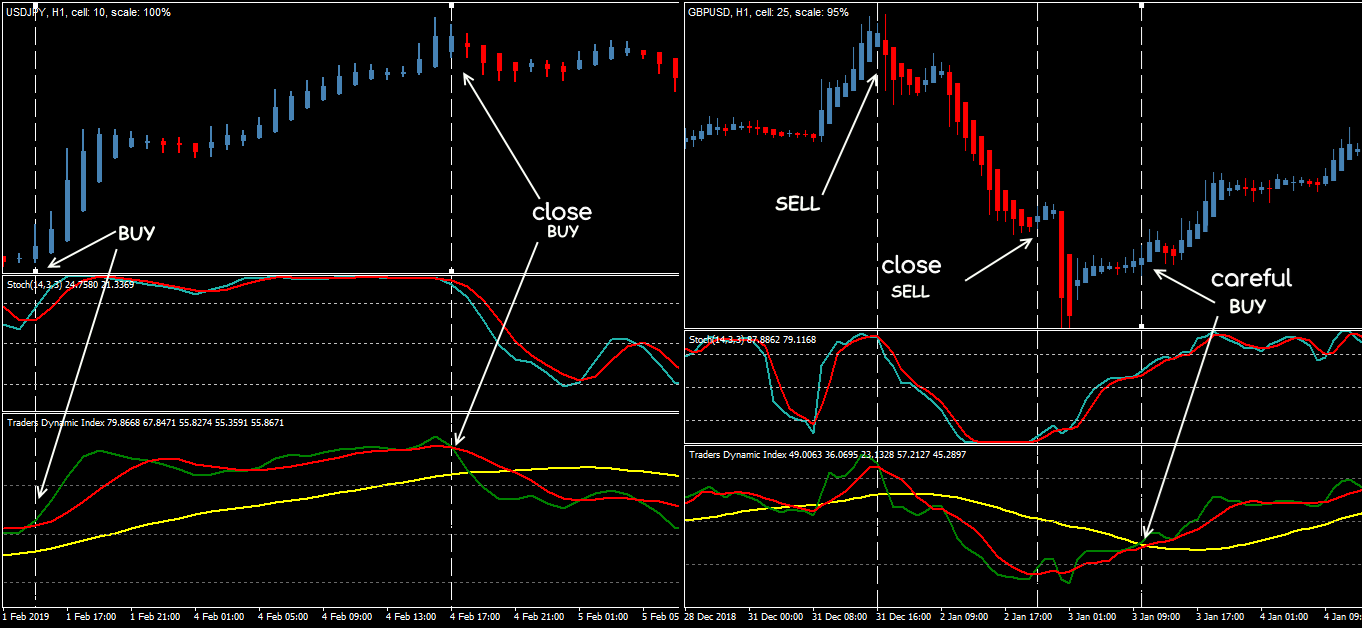
Strategy 15: TDI System
Indicators: Heikin-Ashi; Stochastic (14; 3; 3; close; 20, 50, 80); TDI (14; 0; 34; 2; 0; 7; 0; 32, 50, 68).
Special conditions: TF is not lower than M30: European and American sessions. Stop Loss is beyond a local extreme. No Take Profit, only trailing. Stochastic is interpreted in reverse order. Position above/below yellow TDI amplifies the signal.
BUY: Stochastic is above 50 (80); the green TDI line crosses the red line from bottom to top; a position above the yellow TDI amplifies the signal.
SELL: Stochastic is below 50 (20); the green TDI line crosses from top to bottom.
Exit: Stop Loss or reverse signal.
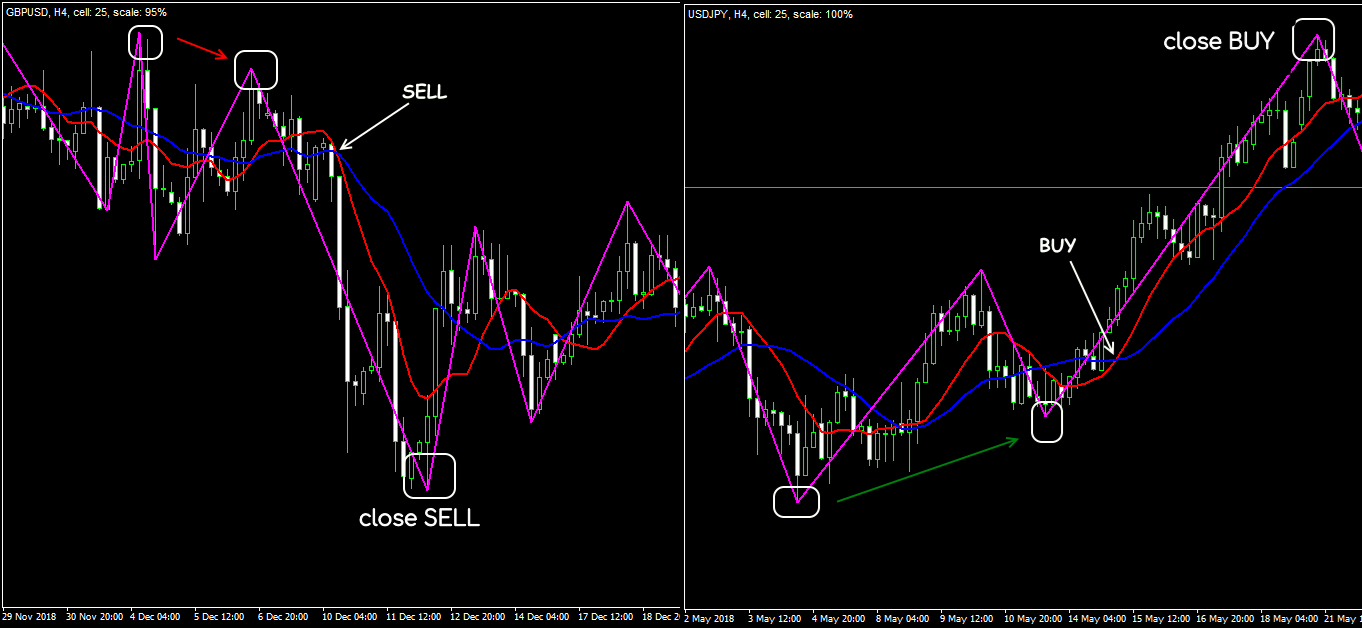
Strategy 16: The Rachek’s Method
Indicators: SMA (10; 0; close); SMA (20; 0; close); ZigZag (12; 5; 3).
Special conditions: TF H4; a required condition is that the price on the rollback should break through the red MA and move to the blue.
BUY: SMA (10) crosses SMA (20) from the bottom up and both lines look up; ZigZag shows two rising minimums.
SELL: SMA (10) crosses SMA (20) from top to bottom and both lines look down; ZigZag shows two rising maximums.
Exit: Stop Loss by MM or appearing of the break point on ZigZag.
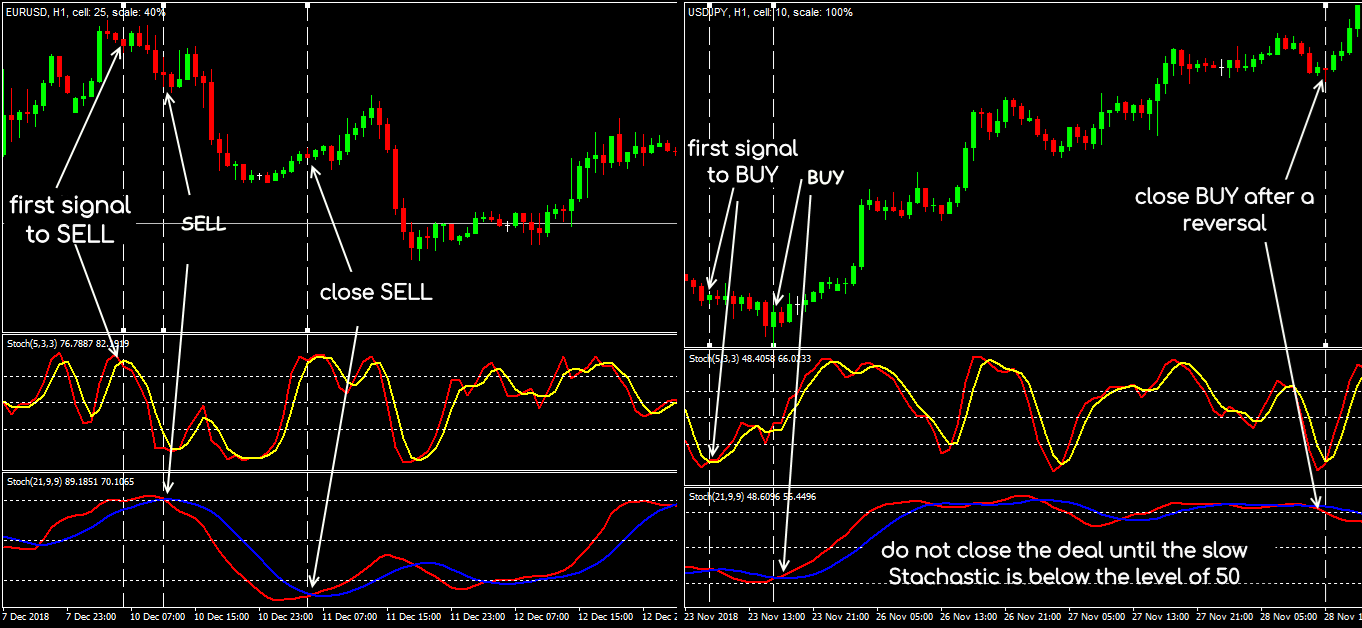
Strategy 17: Two Stochastics
Indicators: Stochastic (5; 3; 3; 30, 70); Stochastic (21; 9; 9; 20, 80).
Special conditions: 1st signal is on fast Stochastic; a deal opens after a similar signal appears on a slow Stochastic.
BUY: the intersection of %K and %D of fast Stochastic in the zone below 30 from the bottom up.
SELL: 1st signal is the intersection of %K and %D of fast Stochastic in the zone below 70 from top to bottom.
Exit: Stop Loss by MM or reverse signal.
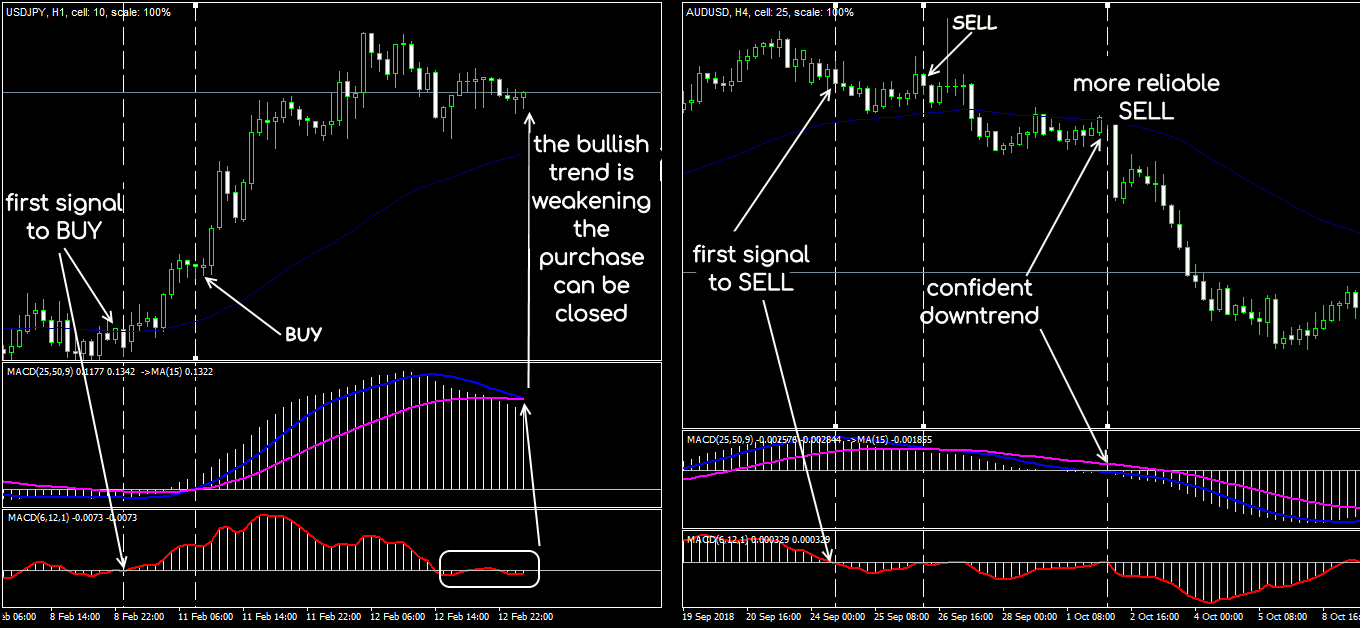
Strategy 18: CDMA
Indicators: SSMA (30; 0; close); MACD (25; 50; 9; close) with SSMA (15; 0; Previous Indicator’s Data); MACD (6; 12; 1; close).
Special conditions: TF is not lower than H1; 1st signal is on fast MACD; trailing is 10-20 points; the global trend is controlled by SSMA (30).
BUY: fast MACD is above the zero line; the slow MACD signal line crosses its balance line from bottom to top, preferably above the zero line.
SELL: fast MACD is below the zero line; the slow MACD line crosses the balance line from top to bottom, preferably in the negative zone.
Exit: Stop Loss or reverse signal.
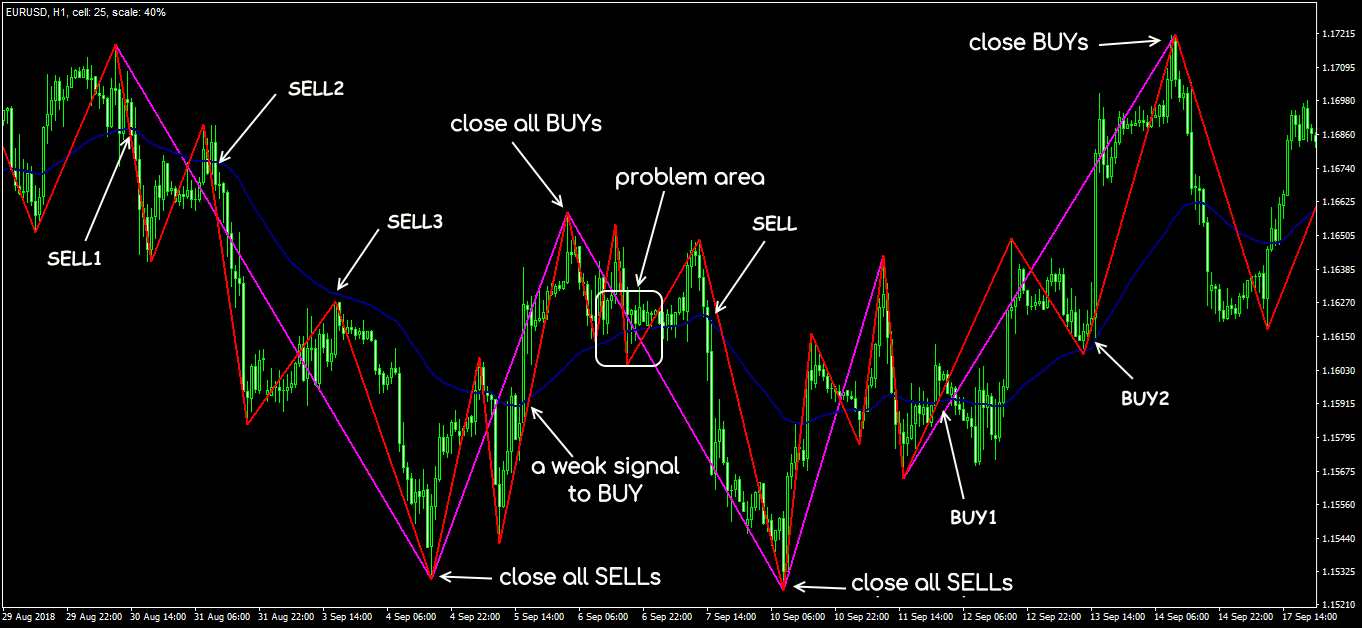
Strategy 19: ZigZag + MA + ZigZag
Indicators: ZigZag (12; 5; 3); EMA (50; 0; close); ZigZag (24; 8; 5).
Special conditions: TF is not lower than H1; speculative signals are ignored; global trend is controlled by EMA (50); we do not close the deal until the slow ZigZag has formed the next extreme. Trailing is 10-20 points.
BUY: slow ZigZag forms min; fast ZigZag crosses the EMA from the bottom up; entry on the next bar.
SELL: slow ZigZag forms max; fast ZigZag crosses the EMA from top to bottom; entry on the next bar.
Exit: Stop Loss by MM or a slow ZigZag reversal.
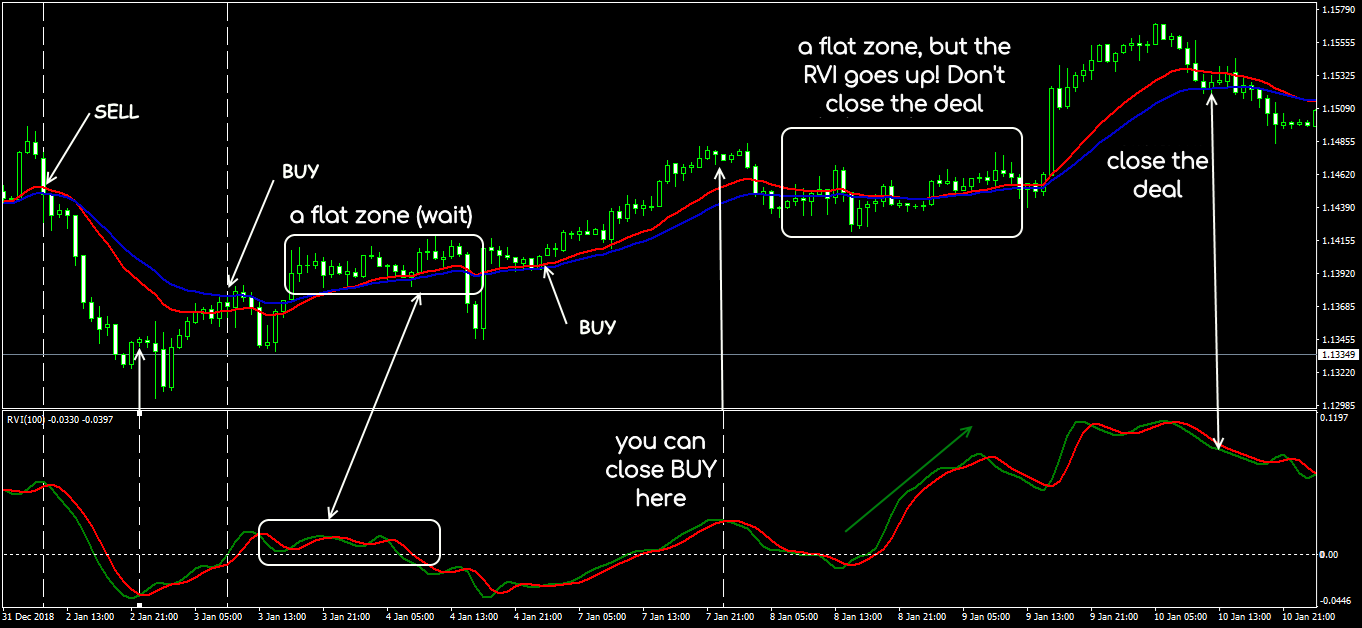
Strategy 20: EMA + RVI
Indicators: EMA (18; 0; close); EMA (28; 0; close); RVI (100).
Special conditions: TF is not lower than H1; Stop Loss is put at a local extreme.
BUY: EMA (18) crossed EMA (28) from bottom to top; RVI.
SELL: EMA (18) crossed EMA (28) from top to bottom; RVI.
Exit: Stop Loss by MM or reverse signal.
Try It Yourself
As you can see, backtesting is quite simple activity in case if you have the right backtesting tools.
The testing of this strategy was arranged in Forex Tester with the historical data that comes along with the program.
To check this (or any other) strategy’s performance you can download Forex Tester for free.
In addition, you will receive 23 years of free historical data (easily downloadable straight from the software).
