List of strategies 3
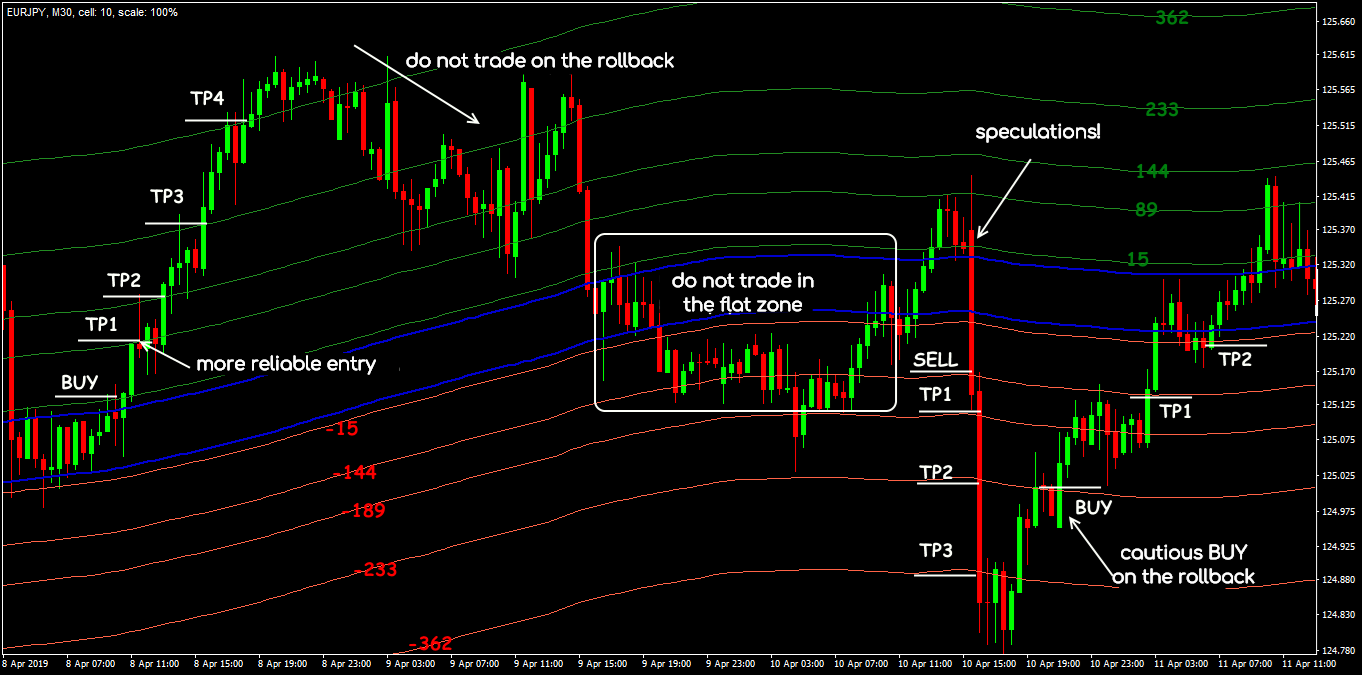
Strategy 21: SMA Tunnel
Indicators: SMA (233, 0, high) with levels of 15, 89, 144, 233, 362 (green channel); SMA (233, 0, low) with levels of (−15), (−89), (−144), (−233), (−362) (the red one).
BUY: at a breakdown of the upper boundary of the main channel from the bottom up and closing above the level of 15.
SELL: at a breakdown of the lower boundary from top to bottom and closing below the level of (−15).
Special conditions: TF for analysis and control is not less than M30. A more reliable entry is at a breakdown of the next level. Immediately divide the position into 3-4 equal orders by setting TP consecutively at the levels of 89 (−89), 144 (−144), 233 (−233), 362 (−362). The first SL for all orders is placed at the first level on the back side of the tunnel, further – at the opening level and power levels.
Exit or reversal: is by SL/TP; the entrance on the rollback is only with a reverse breakdown of 1 to 2 levels.
Strategy 22: Two Groups of SMA
Indicators: “short” group - SMA with periods of 3, 5, 8, 10, 12, 15, at closing price (red); “long” group - SMA: 30, 35, 40, 45, 50, 60; close (blue).
BUY: the “slow” group goes up, and the MAs are in the following order: 30-35-40-45-50-60; the “fast” group also goes up in the strict order: 3-5-8-10-12-15; Buy Stop is put on the max signal candle.
SELL: “slow” and “fast” groups go down (MA is in the strict order); Sell Stop is put on the min signal candle.
Special conditions: TF for analysis and control of the transaction is H4 and higher. SL is on max/min of the signal candle, then trailing with a step of 30-70 points. We do not trade during flat and speculations.
Exit or reversal: is by SL/TP or at the close of the candle after crossing the MA in the “fast” group.
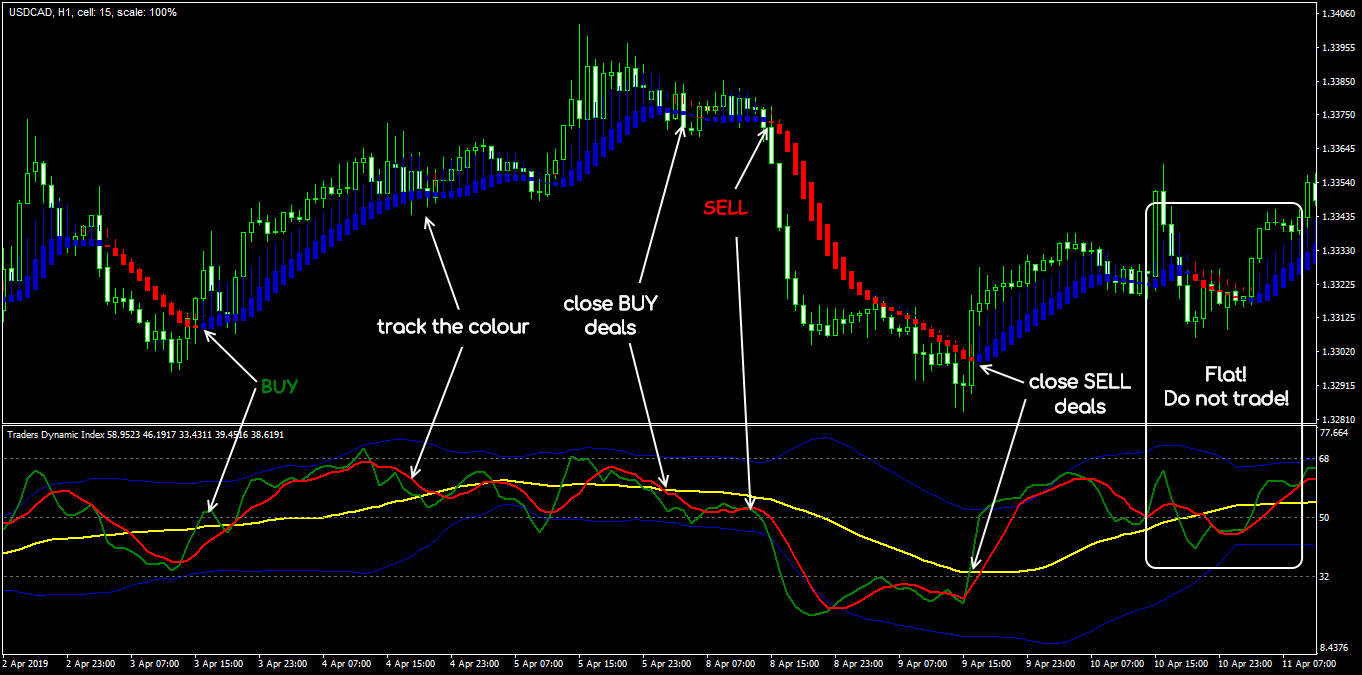
Strategy 23: HeikenAshi + TDI
Indicators: HeikenAshi_Smoothed (2; 6; 3; 2); TDI (13; 0; 34; 2; 0; 7; 0); TDI parameters can be tightened if asset volatility is above average.
BUY: at the point of the new blue HAS candle appearance, the green TDI crosses the red from the bottom up; the yellow TDI moves up; we open the purchase immediately after crossing or at the next bar.
SELL: at the point of the new red HAS candle appearance, the green TDI crosses the red from top to bottom; the yellow TDI looks down; we open the sale after crossing or at the next bar.
Special conditions: TF for entry is H1, for control, is H4. The technique is long-term, SL at the level of average daily volatility. While the green and red TDI are above/below the yellow – the deal can stay open. If the HAS has already shown more than 2 bars of the same color, the signal is skipped.
Exit or reversal: by SL/TP or in one of the following situations: the green TDI is turning (mandatory! with a breakdown of the yellow one); there is approaching of a strong key level; there is more than 10 HAS candles of one color.
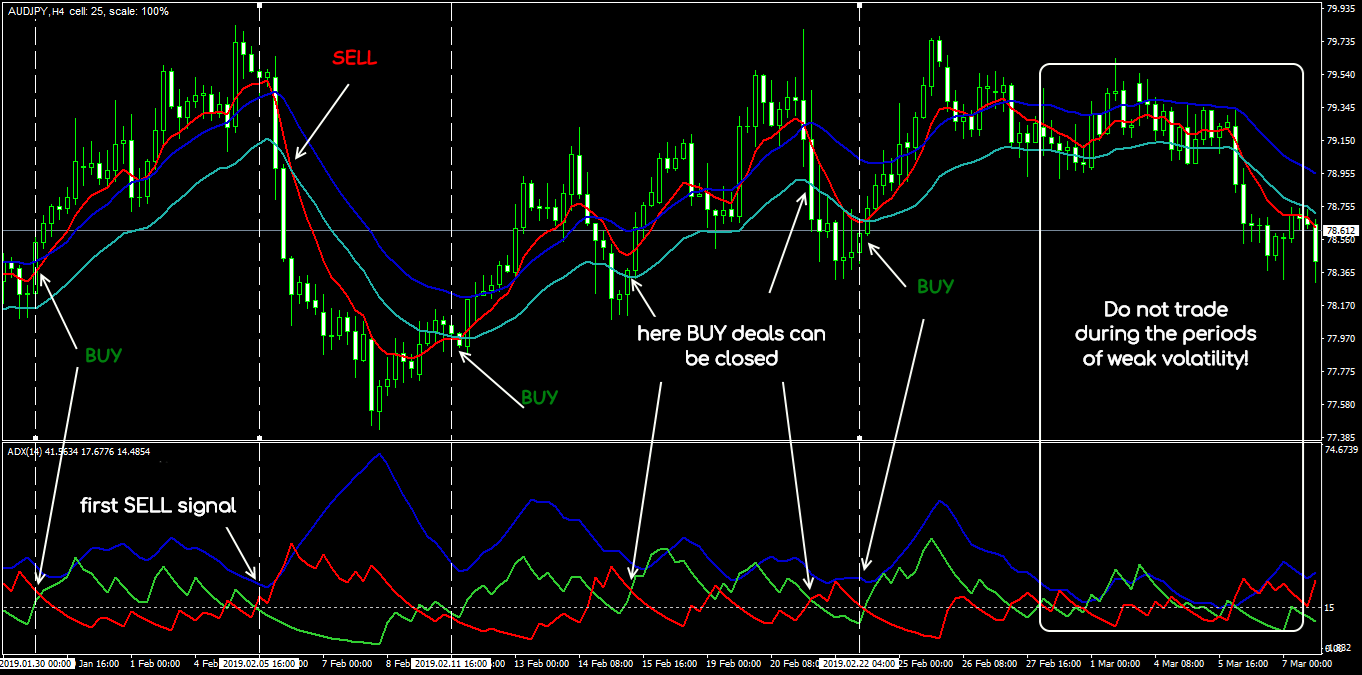
Strategy 24: For Yen Crosses
Indicators: EMA (8; 0; close) (red); SMA (21; 0; high) (blue); SMA (21; 0; low) (blue); ADX (14) with the level of 15.
BUY: EMA (8) crosses SMA (21; high) from the bottom up, the price is closed above; ADX is above the level of 15 and moves up, (+ DI) crosses (- DI) from bottom to top. The entrance is at the opening of the next bar, SL is from 5 to 15 points below the blue line and then trailing with such step.
SELL: EMA (8) crosses SMA (21; low) from top to bottom, the price is closed below; ADX is above the level of 15 and moves up, (- DI) crosses (+ DI) from bottom to top. The entrance is at the next candle. SL is from 5 to 15 points above the blue line.
Special conditions: TF for analysis and control is not lower than H1-H4. The method is medium-term, adapted for currency pairs with JPY. When selling, it is recommended to put a bigger SL.
Exit or reversal: by SL/TP or at the reverse signal.
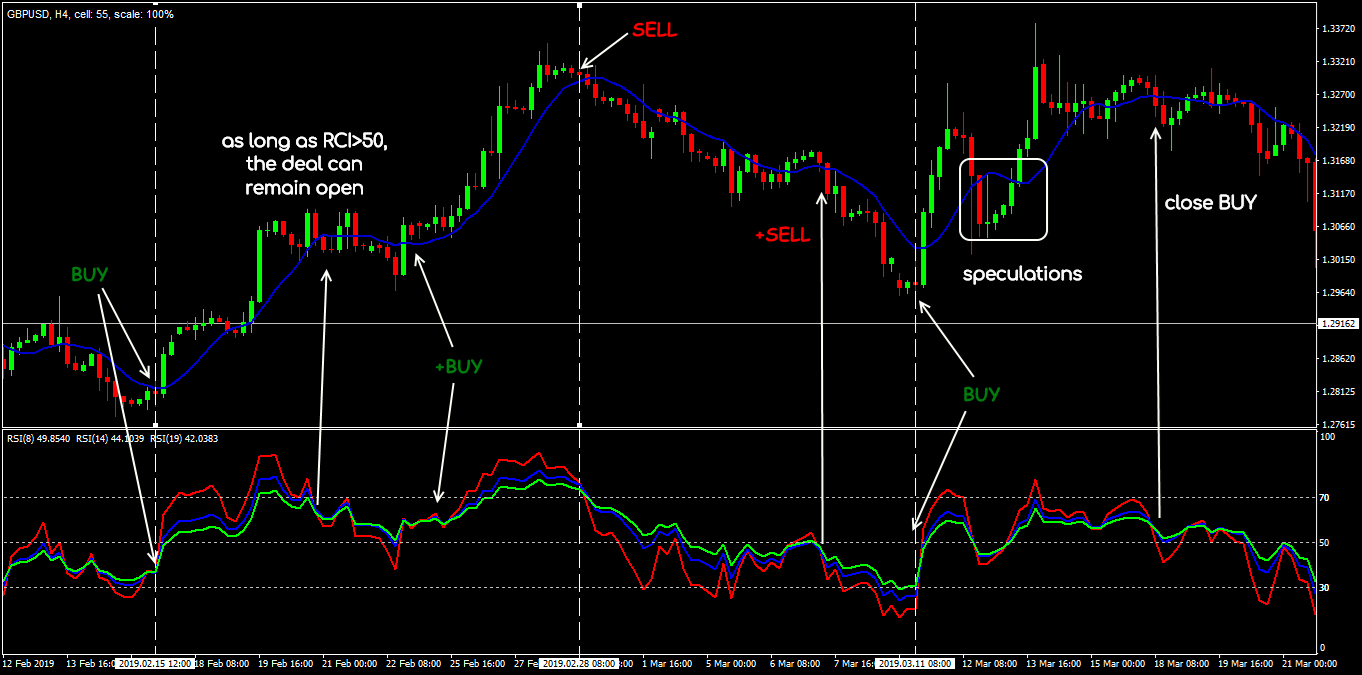
Strategy 25: Nial Fuller’s Three Oscillators
Indicators: RSI (8), RSI (14), RSI (19) with levels of 30, 50, 70; SMA (9).
BUY: the previous period is closed above SMA (9); oscillators are in the order of 19-14-8 from the bottom up (the red line is above all); the entrance is at the next bar after the intersection of the lines.
SELL: the previous period is closed below SMA (9); oscillators are in the order of 19-14-8 from top to bottom (the red line is below all); the entrance is at the next bar after intersection.
Special conditions: TF for analysis and control is at H4 − W1. Consider signals at D1 at the closing price of the day, at W1 − at the Friday’s closing price. SL is at 10 to 20 points from the SMA with trailing along the line. While the RSI link is above/below the level of 50, you should not close the deal. Do not trade during speculations and explicit flat.
Exit or reversal: by SL or at the reversal signal.
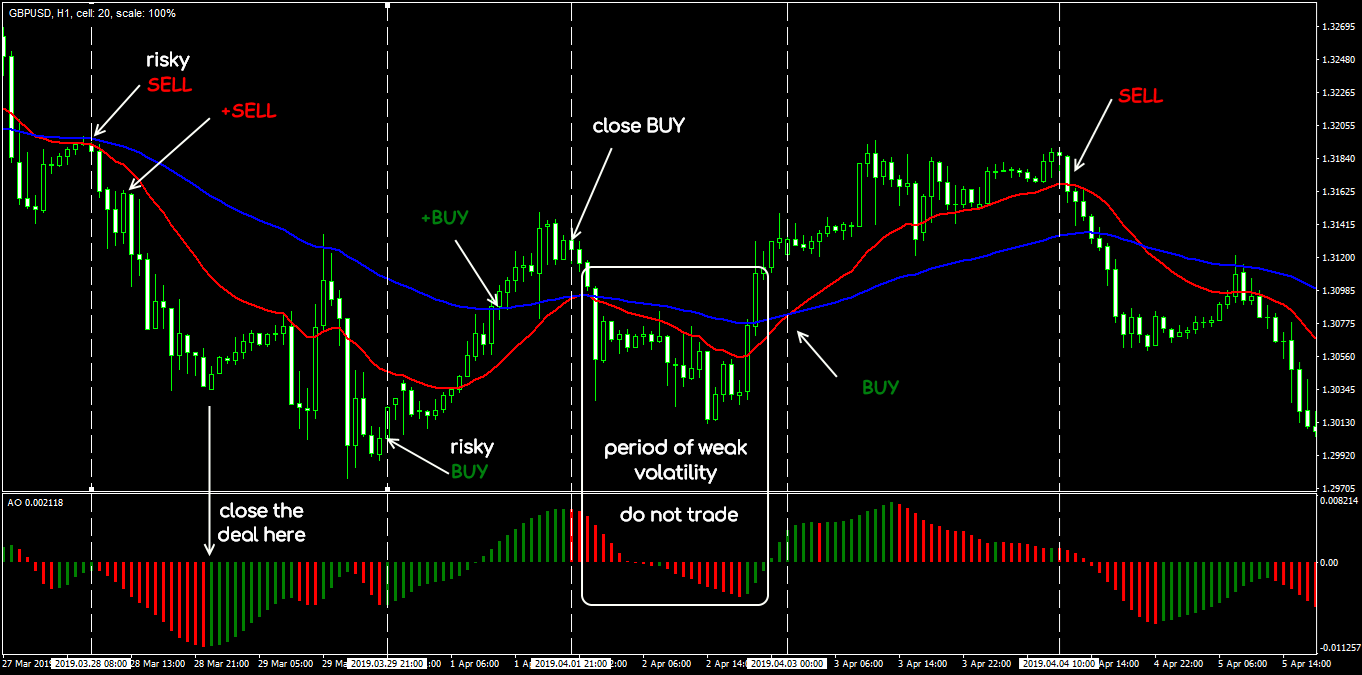
Strategy 26: BullDozer
Indicators: EMA (21; close); EMA (70; close); Awesome Oscillator with standard parameter settings.
BUY: the closing price is above EMA (70), EMA (21) is below EMA (70); AO histogram is green with an upward trend.
SELL: the closing price is below EMA (70), EMA (21) is above EMA (70); the AO histogram is red and declining.
Special conditions: TF for analysis and maintenance is H1. SL is from 30 to 50 points from the opening price with trailing; TP is not needed or according to MM.
Exit or reversal: by SL or when the histogram crosses the zero line; if the price goes 50 to 70 points in profit, it is recommended to close part of the volume.
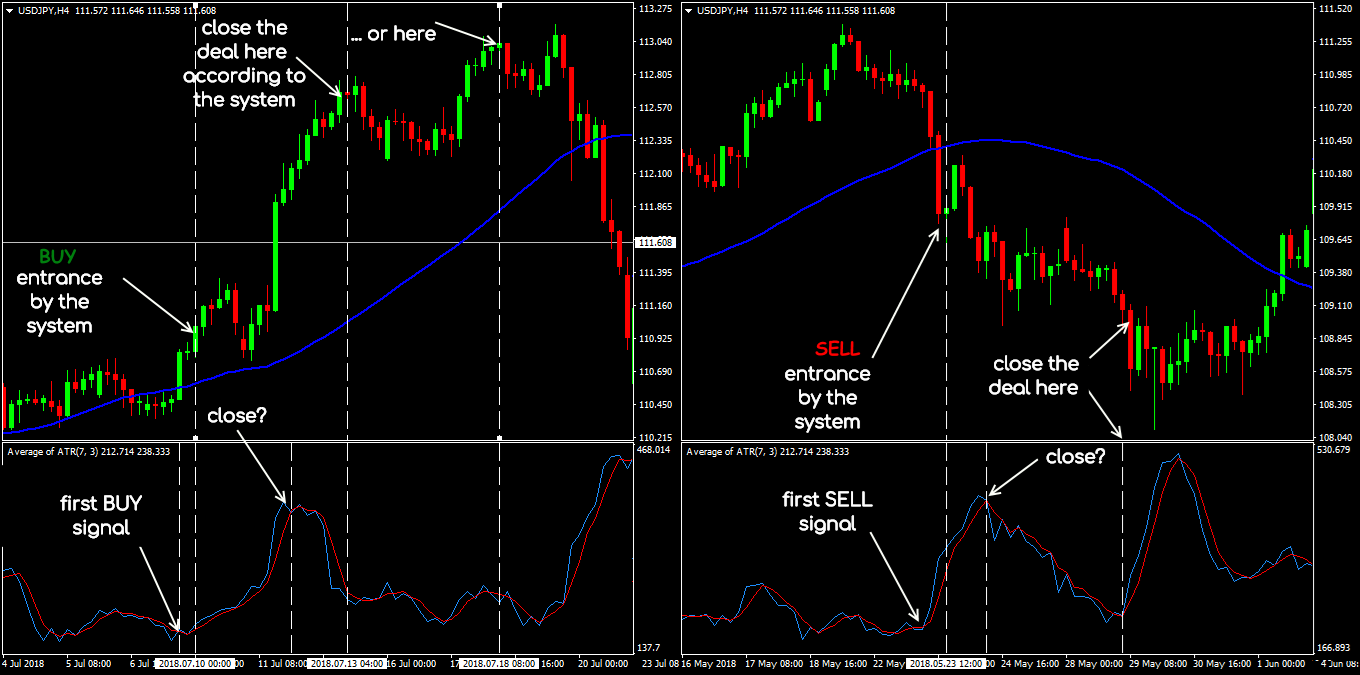
Strategy 27: 4UJ
Indicators: SMA (48, close); Average_of_ATR (7; 30).
BUY: the price is above SMA (48); ATR crosses its MA from the bottom up; the entrance is at the next bar.
SELL: the price is below SMA (48); ATR crosses its MA from top to bottom; the entrance is at the next candle.
Special conditions: the strategy is for USD/JPY, TF for analysis and control is H4. It is supposed to trade on stable volatility; do not trade during flat and speculations. The minimum SL is 25 points, at a profit of 25 to 30 points shift to the breakeven. TP is 100 to 120 points.
Exit or reversal: by SL/TP or at the reverse signal. Transactions can be held until the reverse breakdown of SMA (48), but the oscillator can give early “false” signals, so act strictly according to the system.
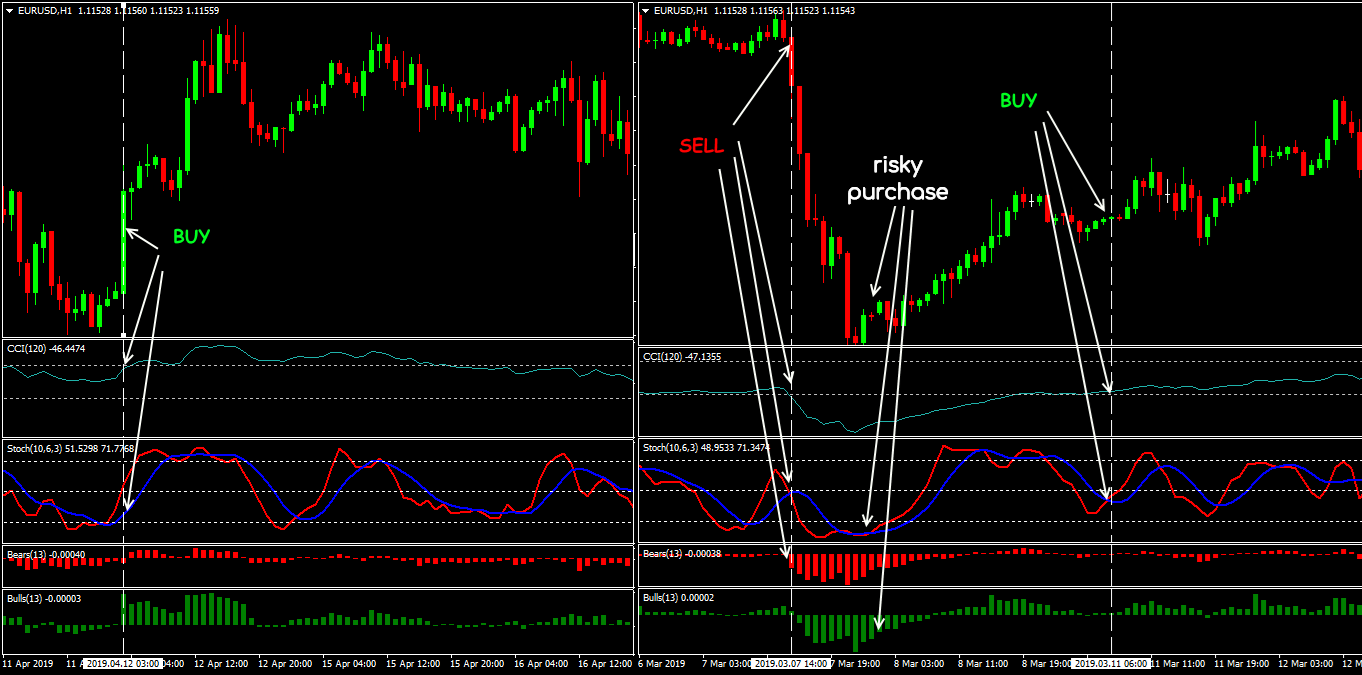
Strategy 28: CSBB
Indicators: CCI (120); Stochastic (10; 3; 6); Bears (13); Bulls (13).
BUY: CCI is above the level of (+100), Stochastic is directed upwards, but still below its level of 80; Bulls above zero shows a strong signal. If Stochastic is already at the level of 80 or higher, wait for a decrease and a new intersection of lines (the main one is above the signal line).
SELL: CCI is below the level of (+100), Stochastic goes down, but still above its level of 20; Bears below the zero line shows a strong signal. If Stochastic is already at the level of 20 or lower, wait for growth above the level and intersection of lines (the main one is below the signal line).
Special conditions: TF for entry and control of the transaction is not lower than H1. In the CCI range of [0; +100; 0] trade only for the purchase, in the range of [0; −100; 0] only sell. SL is 20 pips + spread; after 30 points of profit, the transaction should be shifted to breakeven.
Exit or reversal: at the reverse signal or by SL/TP.
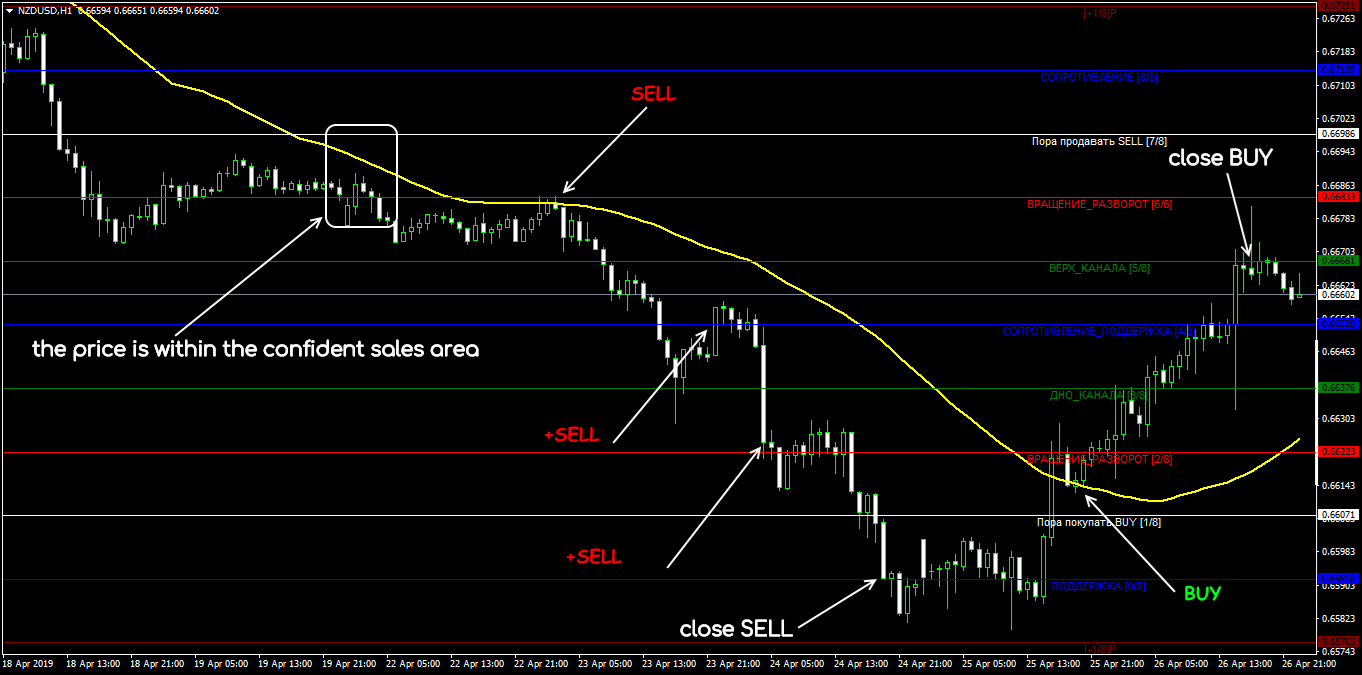
Strategy 29: Murray + Trend
Indicators: Murrey_Levels_System (64; 0); SMA (50; close).
BUY: the price is above the SMA and in the purchase area according to the Murray method.
SELL: the price is below the SMA and in Murray sales area.
Special conditions: TF is not lower than H1. SL is at the previous Murray level. As the force levels are being approached, it is recommended to tighten SL and increase the position volume while maintaining the general trend.
Exit or reversal: by SL, MM or at the reverse.
Strategy 30: CAW
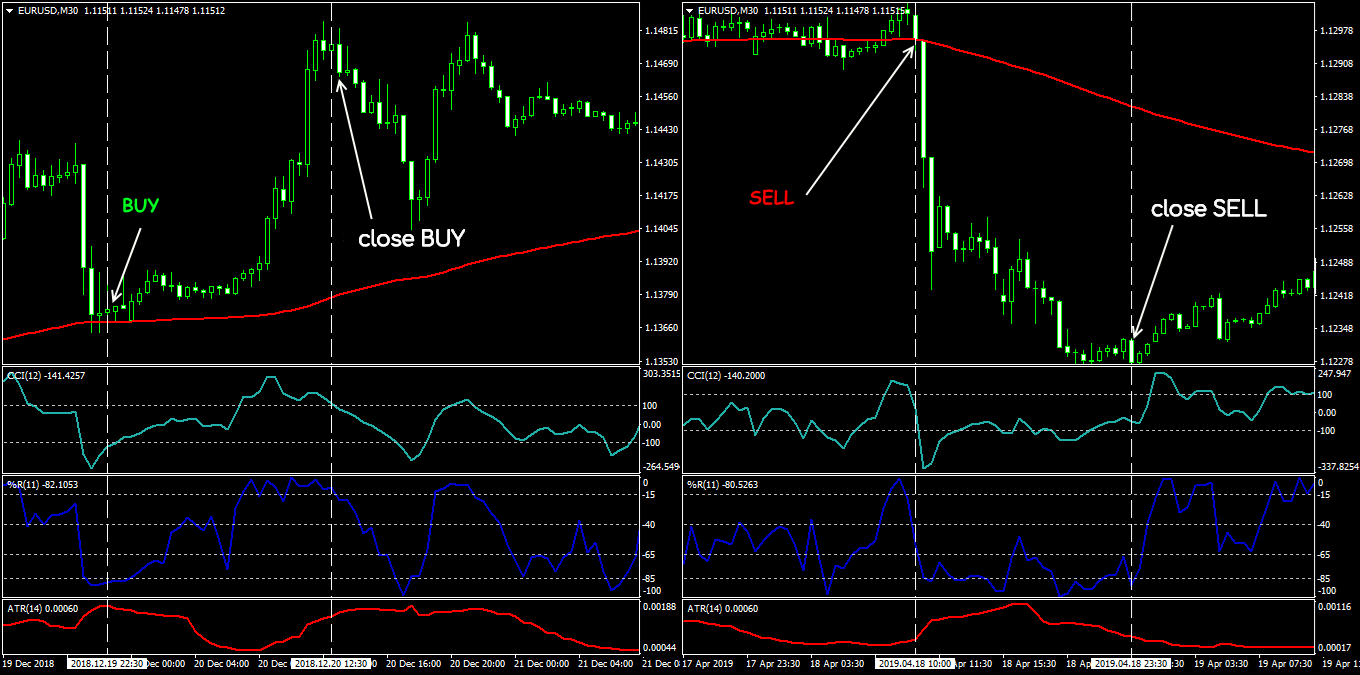
Indicators: SSMA (90; close); CCI (12; Typical); ATR (14) with a level of 0.002; WPRange (11) with the levels of (−15), (- 40), (−60), (- 85).
BUY: the price is above the SSMA; WPR is below the level of (−85); ATR is above 0.002; CCI goes up after a reversal in the oversold zone (below −100).
SELL: the price is below the SSMA; WPR is above the level of (−85); ATR is above 0.002; CCI turned down from the overbought zone (above +100).
Special conditions: TF is from M5 to H1. The entrance is only after the signal bar closing. SL is from 10 to 15 points from the opening price; TP is at least 50 points. Do not trade during speculations and explicit flat, even if the indicators show a “signal”.
Exit or reversal: at the reverse signal or by SL/TP.
Try It Yourself
As you can see, backtesting is quite simple activity in case if you have the right backtesting tools.
The testing of this strategy was arranged in Forex Tester with the historical data that comes along with the program.
To check this (or any other) strategy’s performance you can download Forex Tester for free.
In addition, you will receive 23 years of free historical data (easily downloadable straight from the software).
