List of strategies 4
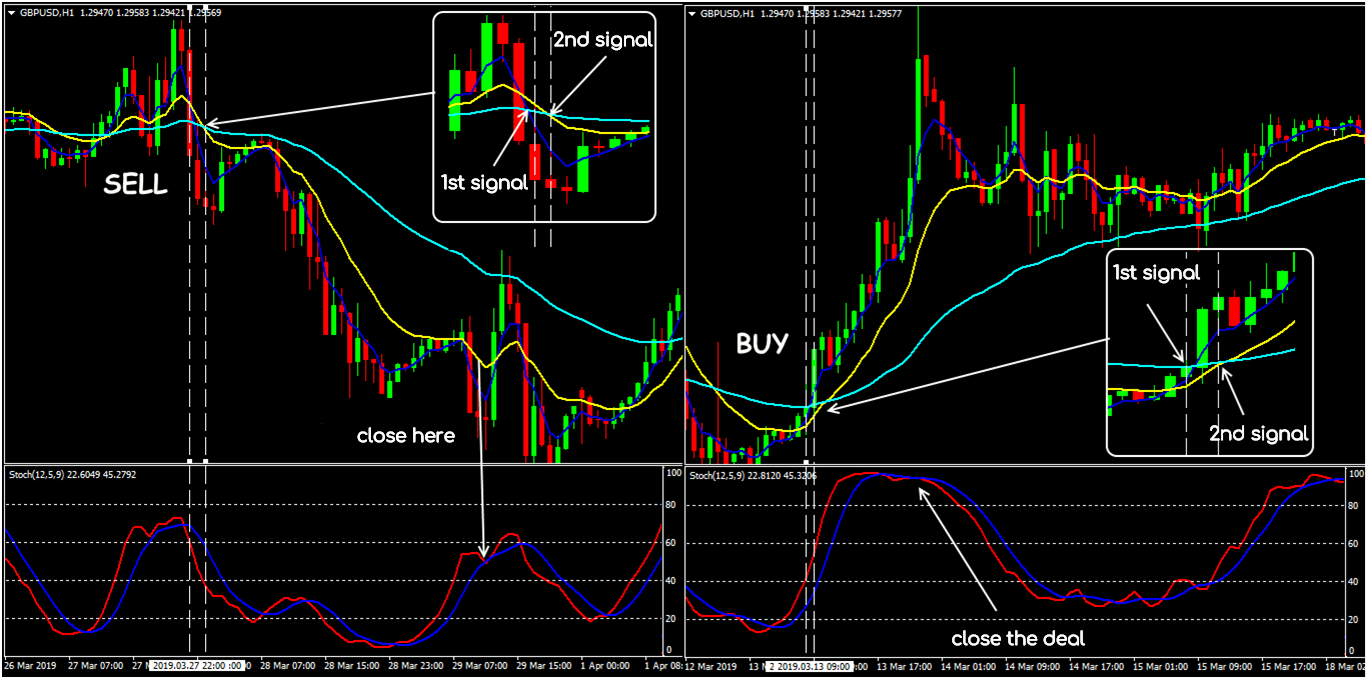
Strategy 31: 3 EMA + Stochastic
Indicators: EMA (4) (dark-blue), EMA (13) yellow, EMA (50) (blue), without offsets, at close prices; Stochastic (12; 9; 5; close/close) with the levels of 20, 40, 60, 80.
BUY: ЕМА (4) crosses ЕМА (50) from bottom to top (1st signal); then EMA (13) breaks through EMA (50) from the bottom up (2nd signal); Stochastic goes up from the oversold zone, the red line is above the dark-blue.
SELL: from top to bottom: first EMA (4) – EMA (50) (1st); then EMA (13) – EMA (50) (2nd); Stochastic goes down from the overbought zone, the red line is below the dark-blue.
Special conditions: TF is not lower than H1; Stop Loss is not less than 30 to 50 points or higher/lower than EMA (50). After 50 points of profit, move Stop Loss to breakeven and start trailing along with the EMA (50). The entrance is at the next bar after all conditions are met.
Exit or reversal: by a reverse Stochastic: for a purchase – above the level of 60 (80), for a sale – below the level of 40 (20).
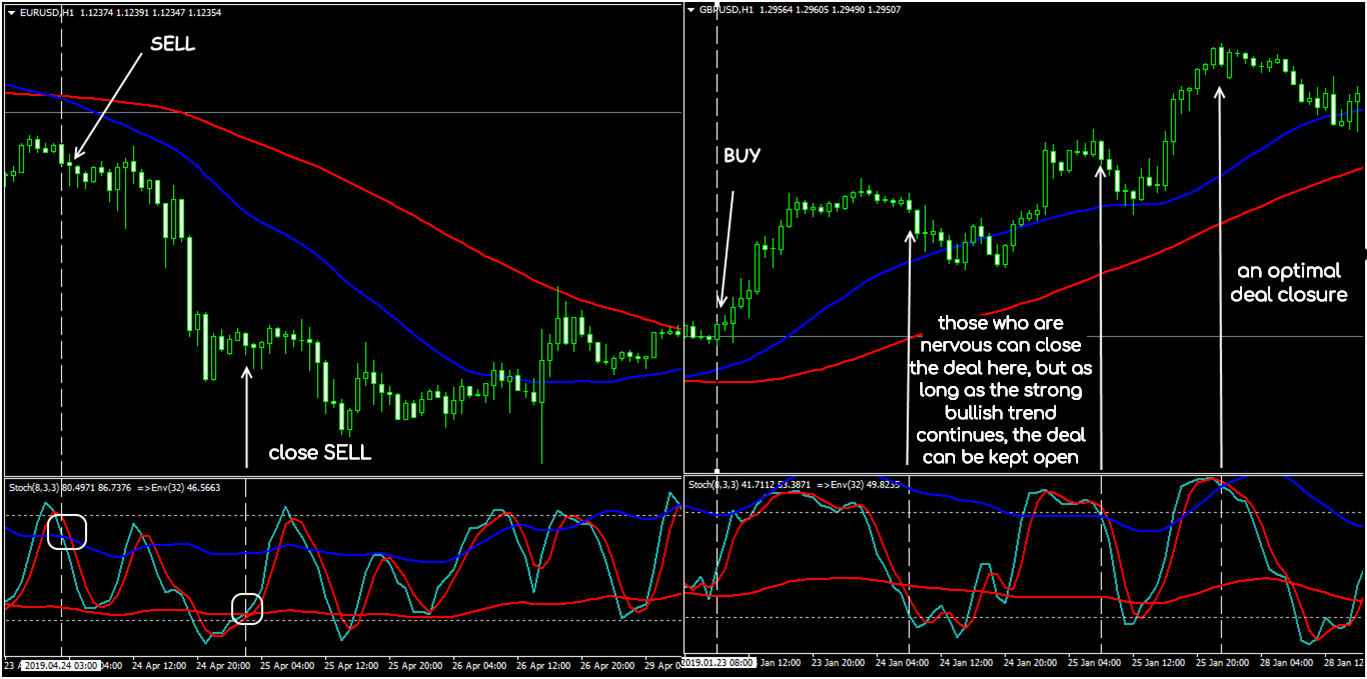
Strategy 32: Sten
Indicators: SMA (78; 0; close); SMA (36; 0; close); Stochastic (8; 3; 3); Envelopes (32; 42) on Stochastic data.
BUY: the price is above SMA (78); SMA (36) is above SMA (78); Stochastic goes up from the area below 20 and crosses the bottom line of Envelopes from bottom to top.
SELL: the market is below SMA (78); SMA (36) is below SMA (78); Stochastic turns down from the zone above 80 and crosses the top Envelopes from top to bottom.
Special conditions: TF is not lower than H1 in a normal market. The entrance is at the next bar after the key one. Stop Loss is at least 30 points; Take Profit is 60-70 points. Stop Loss is transferred to breakeven at 30 points of profit.
Exit or reversal: by Stop Loss / Take Profit or by canceling the signal of all system indicators. While there is a strong trend, the signals of movements are a priority.
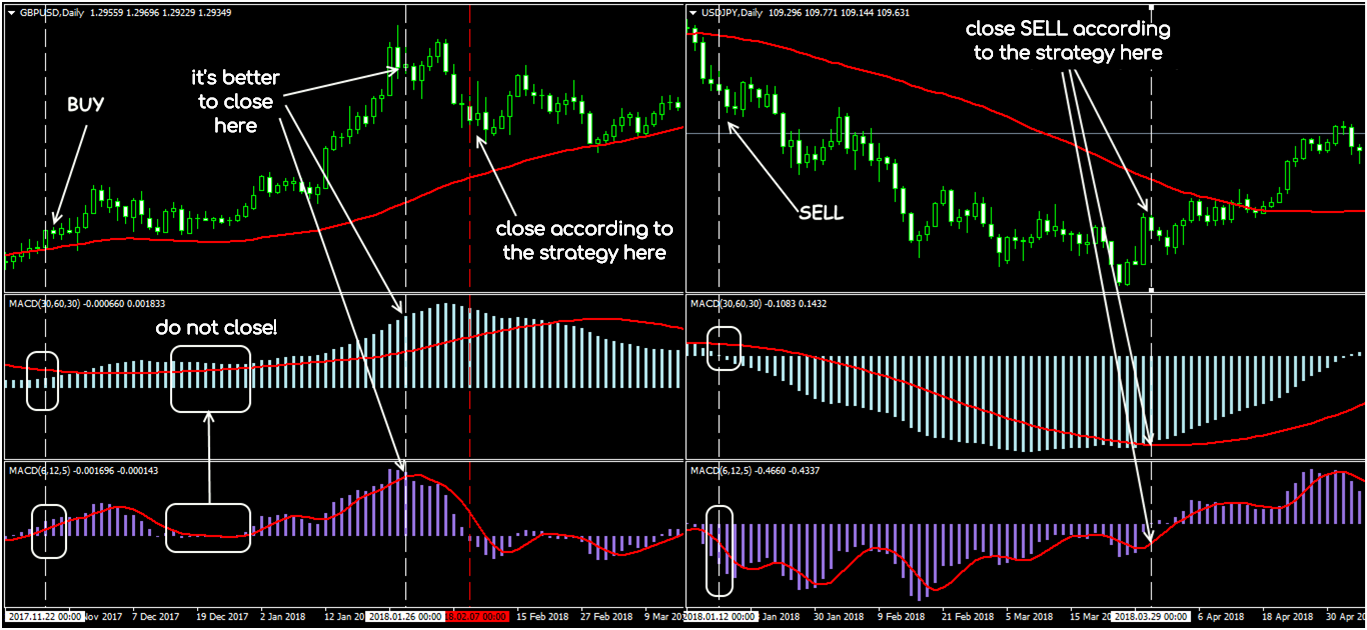
Strategy 33: Double MACD
Indicators: MACD (30; 60; 30; close) (senior); MACD (6; 12; 5; close) (junior); SMA (60; 0; close).
BUY: the price is above SMA; senior MACD is above the zero line; junior MACD is above zero or moves from bottom to top near the balance line.
SELL: the market is below SMA; senior MACD is below zero; junior MACD is below zero or moves upwards in the area of the balance line.
Special conditions: TF is D1; EUR/USD, GBP/USD, USD/JPY are traded. The entrance is at the next bar after all conditions are met. Stop Loss is at least 50 to 70 points.
Exit or reversal: close after the reversal of the senior MACD and confirmation on the histogram of the junior one. If the next candle closes above/below the SMA (60) against an open order, then the deal should be closed immediately.
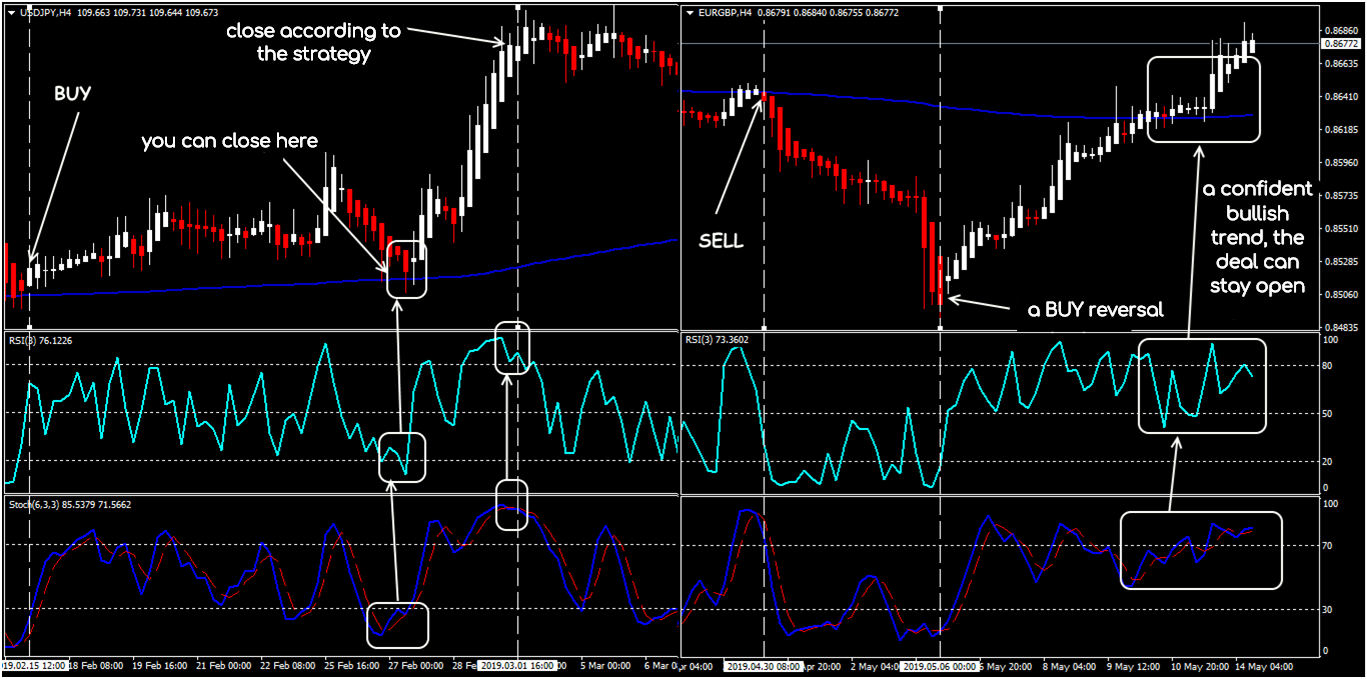
Strategy 34: 2x2
Indicators: SSMA (150; 0; close); Heikin Ashi; RSI (3; close) with the levels of 80, 50, 20 is the 1st signal; Stochastic (6; 3; 3) and the levels of 70, 30 is the 2nd signal.
BUY: the price is above SSMA; Heikin Ashi bar is white (or green); RSI breaks the level of 20 from the bottom up; Stochastic (6, 3, 3) intersects in the zone below 30 and turns up.
SELL: the price is below SSMA (150); Heikin Ashi Bar is red; RSI (3) breaks through the level of 80 from top to bottom; Stochastic intersects in the area above 70 and turns down.
Special conditions: TF is H4-D1. Stop Loss is above/below the last local extremum; Take Profit is 2 to 3 Stop Loss or trailing with a step from 30 to 50 points.
Exit or reversal: by Stop Loss / Take Profit or a complete signal cancellation. Follow the general trend and do not rush to close the deal with unclear signals of the oscillators.
Strategy 35: Sardar
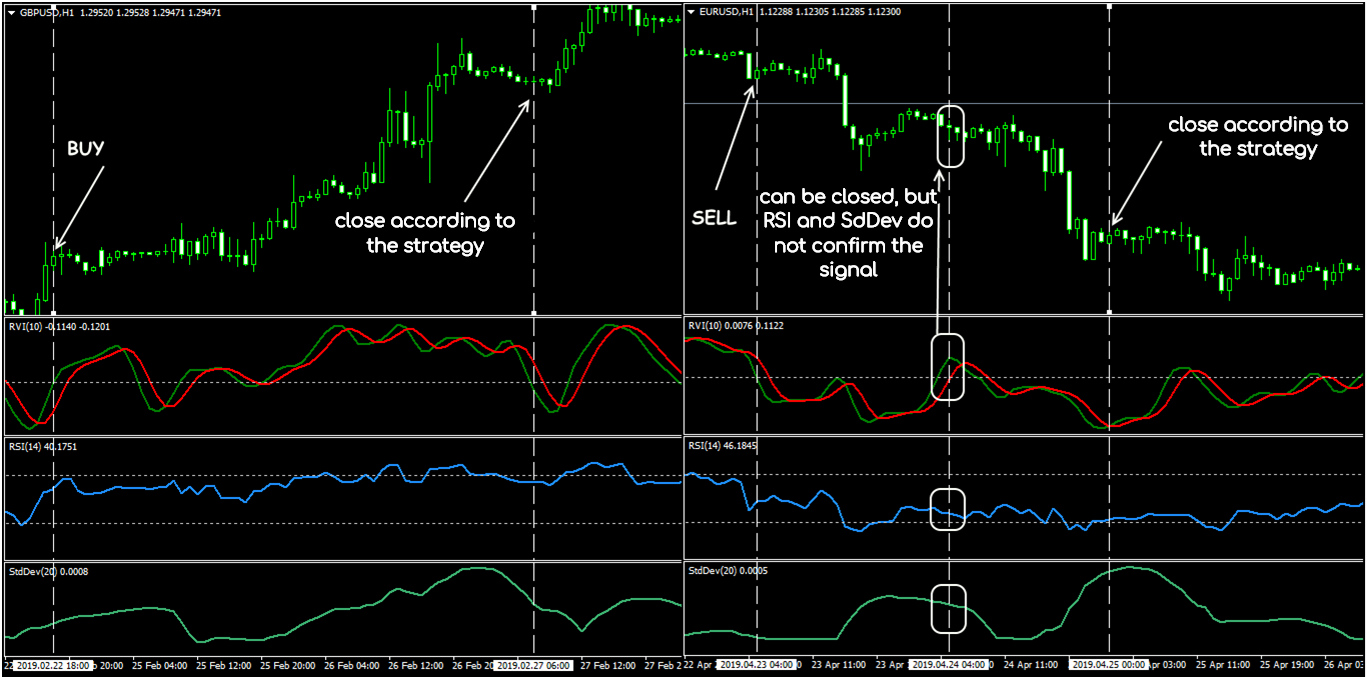
Indicators: RVI (10); RSI (14) levels of 30, 70; StandardDeviation (20).
BUY: RVI crosses the balance line from the bottom up; on this bar, RSI and StdDev should be higher than previous values.
SELL: RVI crosses the zero line from top to bottom; RSI and StdDev should decline on the same candle.
Special conditions: TF is not lower than H1; the main currency pairs are traded in the normal market. The entrance is at the opening of the next bar after the key one. Stop Loss is not less than 35 points, after 30 points - transfer to breakeven, Take Profit is at 100 points.
Exit or reversal: by Stop Loss / Take Profit or at the reverse signal.
Strategy 36: Ranger
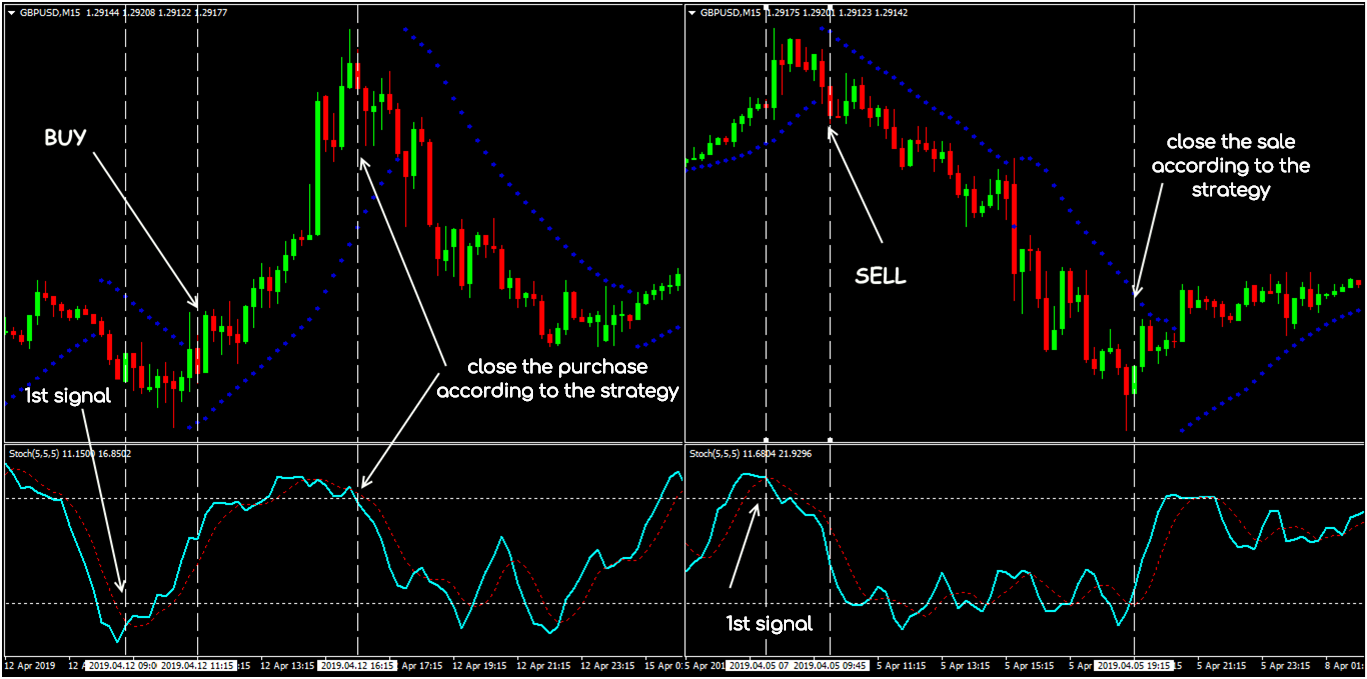
Indicators: ParabolicSAR (0.04; 0.1); Stochastic (5; 5; 5) levels 75 and 25.
BUY: Stochastic lines intersect in the area below 25 and turn up, provided that Parabolic moves below the price.
SELL: Stochastic lines are turning down from the overbought zone (above 75), and Parabolic is moving above the price.
Special conditions: TF is from M15 and above. Parabolic breaks on gaps or speculations are not considered a signal. Stop Loss is at the level of the last local max/min, but not more than 20 points. Take Profit is 2 to 3 Stop Loss + trailing with a step of 20 points. The entrance is at the next candle after the signal one.
Exit or reversal: by Stop Loss / Take Profit; if Stochastic reaches the opposite value or a gap on Parabolic appears, the deal should be closed at the current price.
Strategy 37: UMI
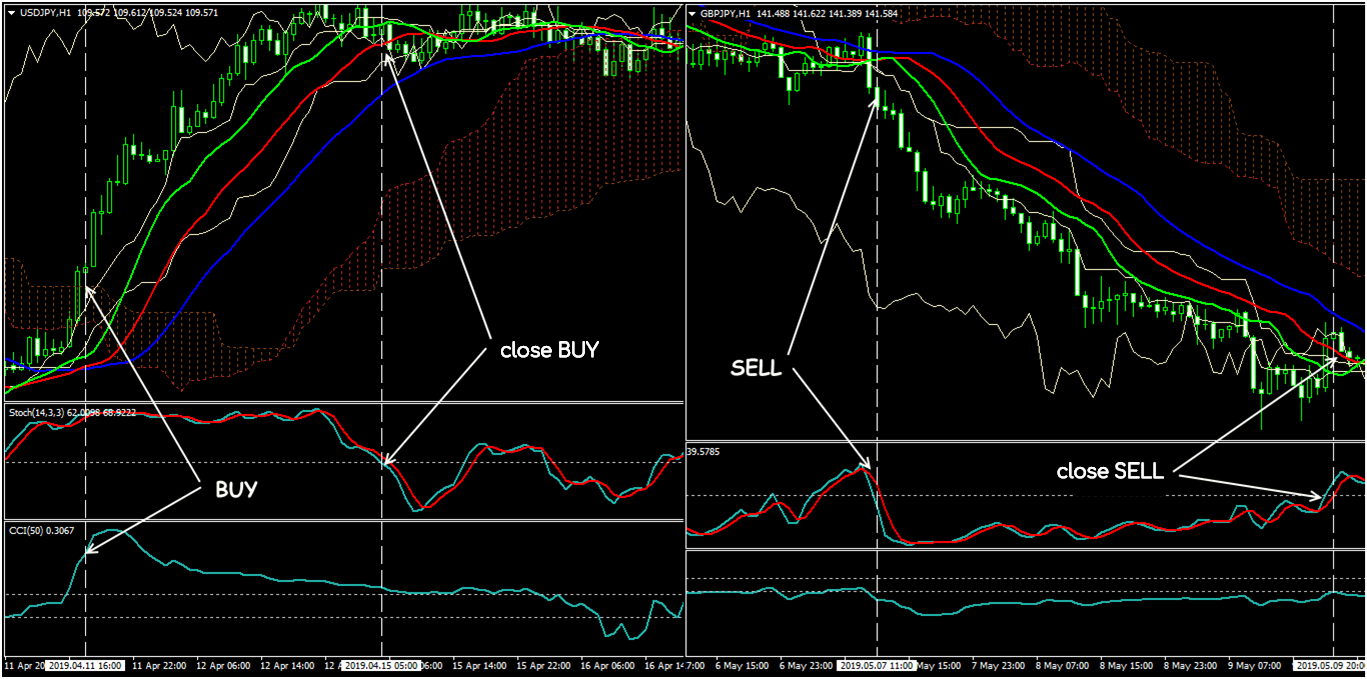
Indicators: Ichimoku (9; 26; 52) - only the Kumo cloud; Alligator (13; 8; 5); Alligator (39; 24; 15); Stochastic (14; 3; 3), the level of 50; CCI (50), the levels of 50/(- 50).
BUY: the candle is closed above the Cloud and above the Alligator indicators; CCI is above the level of 50; Stochastic is above the level of 50.
SELL: the bar is closed below the Cloud and below the Alligator lines; CCI is below its level (-50); Stochastic is below the level of 50.
Special conditions: TF is not lower than H1; USD/JPY and yen crosses of the main currencies are traded. The signals appear sequentially, but at the time of entry, all conditions must be met. The entrance is at the next candle after the signal one. Stop Loss is 35 to 50 points; after 30 points of profit the transaction is shifted to breakeven; primary Take Profit is 100 to 150 points + trailing with a step from 20 to 30 points.
Exit or reversal: by Stop Loss / Take Profit or at a complex reverse signal. If the next candle closes above/below any of the Alligator lines against an open order, then the deal is closed at the current price.
Strategy 38: Ozy
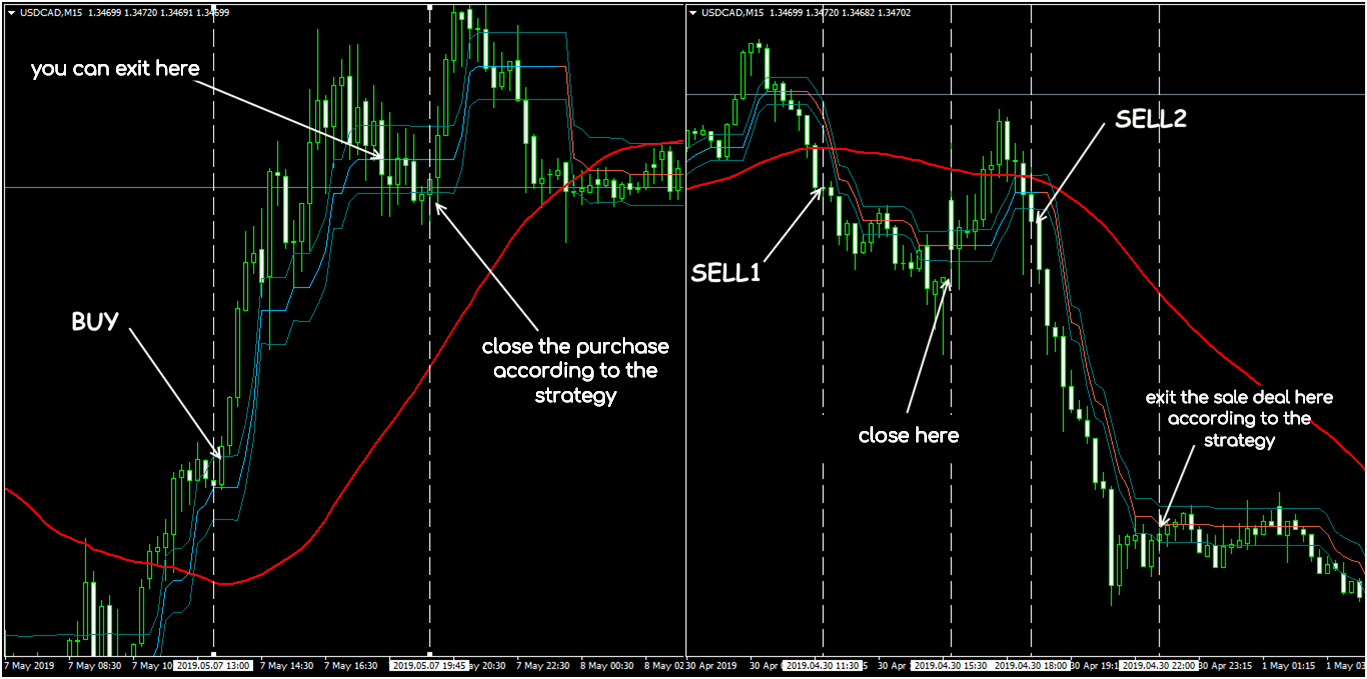
Indicators: SMA (48; 0; close); Ozymandias (3).
BUY: the price is above the SMA, correction is going down, at least to the bottom line of Ozymandias, but the candle’s body does not cross the moving line. The entrance is when the next closed bar will be higher than the upper Ozymandias by no more than 10 points.
SELL: the price is below the SMA, upward correction begins, at least to the upper Ozymandias line, but the moving line does not intersect. The entrance is when the next closed candle will be lower than the lower Ozymandias by no more than 10 points.
Special conditions: TF is M15 and higher; USD/CAD is traded; Stop Loss is 15 points, after 15 points of profit shift to breakeven; Take Profit is 90 to 100 points. Repeated signals are taken to work only if the open transaction is already at breakeven.
Exit or reversal: by Stop Loss / Take Profit or at the reverse signal.
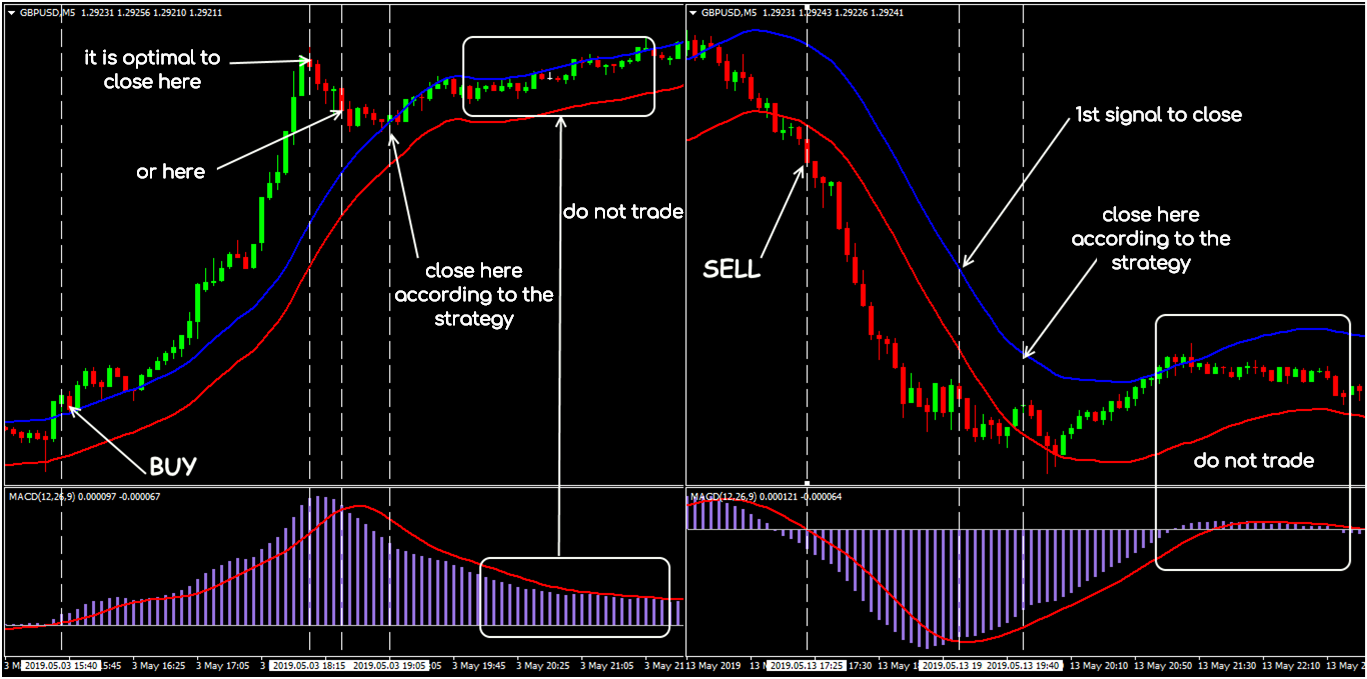
Strategy 39: Envelopes + MACD
Indicators: Envelopes (21; 0.07); MACD (12; 26; 9).
BUY: the price breaks the top line of the Envelopes from the bottom up; a candle is formed, the body of which is completely above this level; MACD histogram is above the zero line.
SELL: the price breaks the bottom line of Envelopes from top to bottom; a candle is formed, the body of which is completely below this level; the MACD histogram is below the zero line.
Special conditions: TF is M5 and higher. If the signal candle formed in the middle of the MACD histogram, the signal is skipped. A pending order is placed: for a purchase – 3 to 5 points below the min, for a sale – 3 to 5 points above the max of the signal candle. Stop Loss is 4 to 5 points above/below the nearest local extremum. Take Profit is 50 to 100 points, trailing with a step of 20 points.
Exit or reversal: by Stop Loss / Take Profit or at the reverse signal.
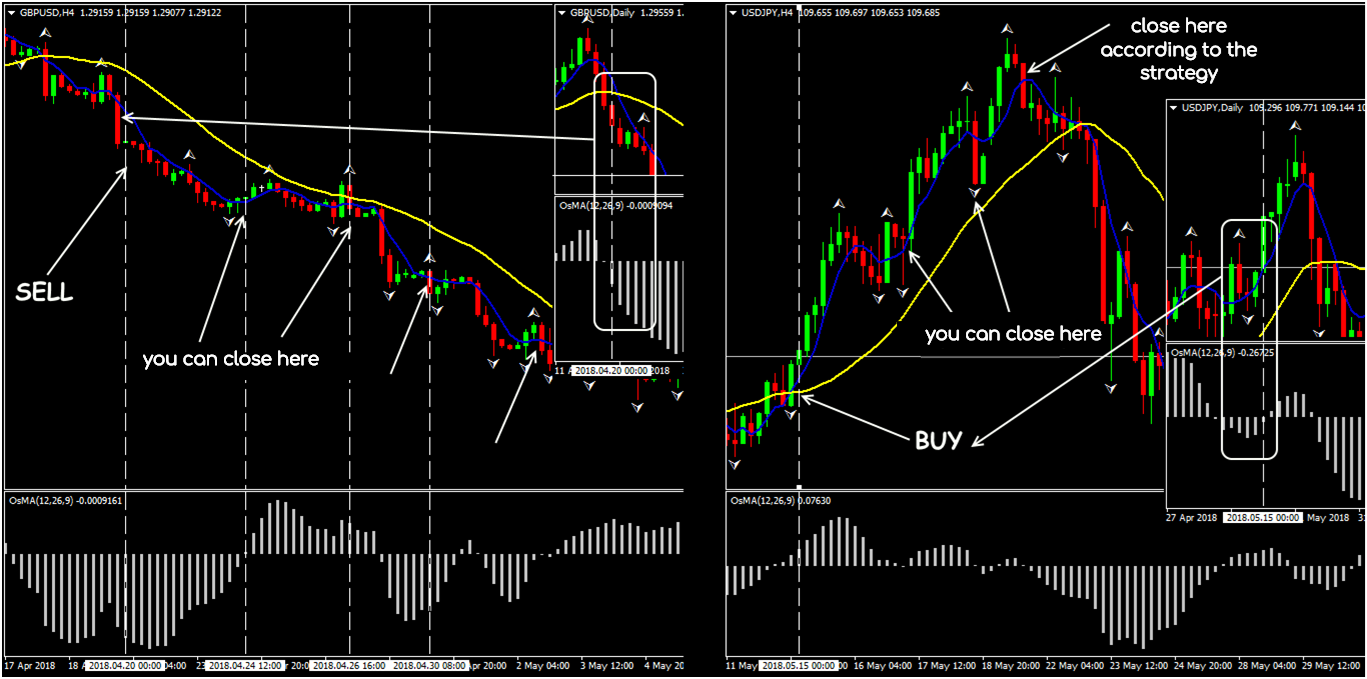
Strategy 40: Fractals + OsMA
Indicators: Fractals; SMA (5; 0; close); SMA (22; 0; close); OsMA (12; 26; 9).
BUY: if on D1 SMA (5) is higher than SMA (22), then wait for the corresponding fractal; go to H4 and open a purchase on the next bar after the appearance of the fractal.
SELL: if on D1 SMA (5) is lower than SMA (22), then wait for the corresponding fractal; go to H4 and open a sale on the next candle after the fractal.
Special conditions: TF is H4-D1. Stop Loss is placed after the nearest local extremum; Take Profit is 2 to 3 Stop Loss.
Exit or reversal: by Stop Loss / Take Profit or at the reverse signal. Trailing with a step of at least 15-20 points is allowed.
Try It Yourself
As you can see, backtesting is quite simple activity in case if you have the right backtesting tools.
The testing of this strategy was arranged in Forex Tester with the historical data that comes along with the program.
To check this (or any other) strategy’s performance you can download Forex Tester for free.
In addition, you will receive 23 years of free historical data (easily downloadable straight from the software).
