English
 Deutsch
 Italiano
 Français
 Português
 ไทย
ไทย
 Tiếng Việt
 Polski
 Türkçe
 Nederlands
 Română
 한국어
한국어
 Español
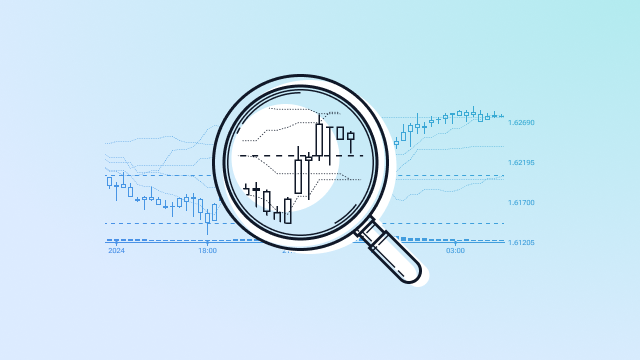
The Moving Average Crossover is a key tool in technical analysis. It helps traders spot buy and sell signals in financial markets.
It works by watching when two moving averages with different time frames cross each other. This can signal a shift in market direction.
Learning to use the Moving Average Crossover well can make your trading better. It can lead to smarter trading choices and better results.
This article will dive into what the Moving Average Crossover is, why it matters, and how to use it in trading strategies.
Key Takeaways
- Definition and explanation of Moving Average Crossover.
- Significance of Moving Average Crossover in trading.
- Practical applications and examples.
- How to integrate Moving Average Crossover into your trading strategy.
- Common pitfalls to avoid when using Moving Average Crossover.
Understanding Moving Averages in Technical Analysis
Moving Averages are key in technical analysis. They smooth out price data over time. This makes it easier to spot trends and patterns.
A Moving Average is the average price of a security over time. It’s called “moving” because it updates as new data comes in. This helps traders understand trend direction and strength.
There are different Moving Averages, like Simple Moving Averages (SMA) and Exponential Moving Averages (EMA). SMA treats all data equally. EMA, on the other hand, focuses more on recent prices, making it more responsive to current trends.
Moving Averages are vital in trading. They help identify trends and signal when to buy or sell. They’re often used with other indicators to create a trading strategy, like the MA Crossover strategy.
The Moving Average Crossover Strategy Explained
A Moving Average Crossover happens when two moving averages with different time periods meet. This shows a possible shift in market direction. It’s a key tool in technical analysis, helping traders spot buy and sell signals.
Definition and Basic Concept
The strategy plots two moving averages on a chart with different time frames. When the shorter-term average meets the longer-term one, it signals a change. This can be a bullish or bearish sign, depending on the direction of the crossover.
Golden Cross vs. Death Cross
There are two main types of Moving Average Crossovers: the Golden Cross and the Death Cross. A Golden Cross is when the short-term average goes above the long-term one, seen as a good sign. On the other hand, a Death Cross is when it goes below, suggesting a possible downturn.
Historical Significance in Trading
Moving Average Crossovers, like the Golden Cross and Death Cross, have played a big role in trading history. They help predict big market shifts. Knowing their past use can offer insights into their current impact.
Understanding Moving Average Crossovers and their past use can boost a trader’s technical analysis skills. It helps them better handle the complexities of the market.
Popular Moving Average Combinations
Traders use different moving average combinations to boost their strategies. These combinations vary based on the time frame, from short-term to long-term.
Short-term Crossovers
Short-term traders focus on 5, 10, and 20 period combinations. These are quick to react to price changes, perfect for those chasing short-term gains.
Medium-term Crossovers
Medium-term traders prefer 20 and 50 period combinations. They strike a balance between quick responses and stability, ideal for swing traders.
Long-term Crossovers
Long-term investors and traders use 50, 100, and 200 period combinations. These are less affected by short-term price swings, helping to spot major trend changes.
| Trading Horizon | Common MA Combinations | Description |
|---|---|---|
| Short-term | 5, 10, 20 periods | Sensitive to recent price movements, suitable for short-term trend followers. |
| Medium-term | 20, 50 periods | Balances responsiveness and stability, ideal for swing traders. |
| Long-term | 50, 100, 200 periods | Less sensitive to short-term fluctuations, used for identifying significant trend reversals. |
The right moving average combination depends on the trader’s goals and risk level. Knowing these combinations is key to mastering the moving average crossover strategy.
Interpreting Moving Average Crossover Signals
The Moving Average Crossover strategy offers insights into market trends. But, understanding its signals needs a careful look. MA crossover signals happen when two moving averages of different lengths meet. This shows a possible shift in market direction.
Bullish Crossover Signals
A bullish crossover happens when a shorter MA goes above a longer MA. This is a sign of a possible uptrend. It’s seen as a buy signal, showing the market is moving up.
Bearish Crossover Signals
On the other hand, a bearish crossover occurs when a shorter MA falls below a longer MA. This suggests a possible downtrend. It’s viewed as a sell signal, showing the market might be falling.
Confirmation with Other Indicators
While MA crossovers are useful, it’s key to check them with other indicators for accuracy. Tools like the Relative Strength Index (RSI), Moving Average Convergence Divergence (MACD), and Bollinger Bands help confirm trading decisions.
| Indicator | Description | Use with MA Crossover |
|---|---|---|
| RSI | Measures market momentum and identifies overbought/oversold conditions | Confirms MA crossover signals by identifying potential trend reversals |
| MACD | Indicates trend direction and momentum | Validates MA crossover signals by confirming trend direction |
| Bollinger Bands | Measures market volatility and identifies potential breakouts | Confirms MA crossover signals by identifying potential breakouts or trend continuations |
Implementing Moving Average Crossovers in Your Trading Plan
To use Moving Average Crossovers, you need a solid plan. This includes how to enter and exit trades, managing risks, and testing your strategy. Each part is crucial for success.
Entry and Exit Strategies
Entry and exit strategies are key when using Moving Average Crossovers. A bullish crossover means buying, while a bearish crossover means selling. Knowing when to buy and sell is vital for making money and avoiding losses.
Risk Management Considerations
Managing risks is essential with Moving Average Crossovers. This means setting stop-loss orders and choosing how big your trades are. Good risk management keeps your money safe when the market goes against you.
Backtesting Your Strategy
Backtesting is a must to check if your strategy works. It tests your strategy on past data to see how it might perform.
Optimizing Parameters
Adjusting your Moving Average Crossover strategy’s settings can make a big difference. Finding the right settings is important for achieving your trading goals.
Evaluating Performance Metrics
It’s important to check how well your strategy did in backtesting. Look at profit/loss ratio, drawdown, and successful trades. These numbers show what’s working and what’s not.
| Performance Metric | Description | Importance |
|---|---|---|
| Profit/Loss Ratio | Compares the average profit to the average loss per trade. | High |
| Drawdown | Measures the peak-to-trough decline in the value of your trading account. | High |
| Number of Successful Trades | Indicates the percentage of trades that were profitable. | Medium |
Backtesting a EUR/USD Forex Trading Strategy Using the MA Crossover
In the ever-evolving world of forex trading, the efficacy of a strategy is not solely proven by its ability to generate profits, but also its resilience during challenging periods. The Moving Average (MA) crossover, a staple for many traders, can exhibit both profitable and loss phases. This article discusses the performance of this strategy during a not-so-favorable period on the EUR/USD pair.
Methodology
Data Selection
- Symbol: EUR/USD
- Testing Period: Spanning the first quarter of 2021, from January to March.
- Timeframe: Daily
Strategy Description
Utilizing a swift 50-period MA juxtaposed with a lagging 200-period MA, the strategy identifies potential market momentum shifts, signaling traders when to enter or exit the market.

Backtesting Results (tested on Forex Tester Online)
| Metric | Value |
|---|---|
| Testing Period: | 01/01/2021 – 01/03/2021 (3 months) |
| Symbol: | EUR/USD |
| Timeframe: | Daily |
| Total Trades: | 36 |
| Profit Trades: | 15 |
| Loss Trades: | 21 |
| Max Profit Trade: | $2,000 |
| Max Loss Trade: | $1,800 |
| Initial Deposit: | $10,000 |
| Net Profit: | -$900 (Representing a 9% loss) |
| Gross Profit: | $18,000 |
| Gross Loss: | $18,900 |
| Profit per Month: | -$300 |
| Average Profitability per Month: | -3% |
| Average Profit per Trade: | $1,200 |
| Average Loss per Trade: | $900 |
| Profit-to-Loss Ratio: | 1.33 |
| Max Drawdown: | $2,500 |
| Profit Factor: | 95% |
| Return: | -9% |
| Max Lot Per Trade Used: | 2.00 |
| Restoration Factor: | 0.36 |
| Reliability Factor: | 41.67% |
| Profit Probability: | 41.67% |
| Loss Probability: | 58.33% |
Performance Metrics:
Of the 36 trades conducted, 15 were profitable while 21 resulted in losses.
The net outcome was a decline of 9% over the three-month period.
Profits and Losses:
From an initial deposit of $10,000, the strategy resulted in a net loss of $900, with the most profitable trade netting $2,000 and the largest loss at $1,800.
Analysis of Results
Strengths:
Despite the overall loss, the strategy had periods of success, as seen with a max profit trade of $2,000.
Weaknesses:
The reliability factor of 41.67% suggests that the strategy might require further refinement. A loss probability of 58.33% calls for careful risk management.
Potential Improvements and Recommendations
Given the performance, integrating additional indicators like Stochastic Oscillator or MACD might help improve entry and exit signals. Moreover, a more stringent risk management system, including setting tighter stop-losses, could curb potential losses.

The MA crossover strategy’s performance on the EUR/USD during these three months underscores the fact that no strategy is foolproof. It serves as a reminder of the volatile nature of forex markets and emphasizes the importance of continuous strategy evaluation and refinement.
Applying MA Crossovers Across Different Markets
MA Crossovers are not just for one market; they work in many. This makes them a key tool for traders in different places.
Stock Market Applications
In the stock market, MA Crossovers help spot trends and signals. A Golden Cross can mean a stock is going up. A Death Cross might mean it’s going down.
Forex Trading with Crossovers
In Forex, MA Crossovers help traders make money from currency changes. They use short and long-term averages to find the best times to buy or sell.
Cryptocurrency and Commodity Markets
MA Crossovers also work in crypto and commodity markets. They help traders deal with the ups and downs, making smart choices based on signals.
| Market | Common MA Combinations | Typical Use |
|---|---|---|
| Stock Market | 50-day, 200-day | Identifying long-term trends |
| Forex | 10-period, 30-period | Short-term trend identification |
| Cryptocurrency | 20-period, 50-period | Navigating high volatility |
Conclusion
Learning about moving average crossovers can really help traders spot trends and make smart choices. It’s a key skill for trading in stocks, forex, and cryptocurrencies. Knowing the basics lets traders move through markets with more confidence.
The moving average crossover strategy is very flexible. It can be adjusted to fit different trading styles and risk levels. Whether you’re looking at short-term, medium-term, or long-term trends, you can find a method that works for you.
Using moving average crossovers in a trading plan can boost your success. It helps with timing your trades and managing risks. Remember, it’s crucial to test and fine-tune your strategy. This ensures it matches your goals and the market’s conditions.
FAQ
What is a Moving Average Crossover?
A Moving Average Crossover is a tool used in finance. It happens when two moving averages with different lengths meet. It helps spot buy and sell chances in the market.
How do I identify a Golden Cross?
Spot a Golden Cross when a short-term average goes over a long-term one. This usually means the 50-day MA is above the 200-day MA. It’s a sign that things might get better.
What is the significance of the Death Cross?
The Death Cross is when a short-term average falls below a long-term one. This is often the 50-day MA going under the 200-day MA. It warns of a possible downturn.
Can Moving Average Crossovers be used in all financial markets?
Yes, Moving Average Crossovers work in many markets. This includes stocks, Forex, cryptocurrencies, and commodities. It’s a flexible strategy for traders.
How do I choose the right Moving Average periods for my strategy?
Picking Moving Average periods depends on your trading goals and risk level. You might use short-term (5,10,20-period), medium-term (20,50-period), or long-term (50,100,200-period) averages.
Should I rely solely on Moving Average Crossovers for my trading decisions?
No, it’s best to use Moving Average Crossovers with other indicators. This helps make sure your analysis is complete and avoids false signals.
How can I backtest my Moving Average Crossover strategy?
Backtesting means testing your strategy on past data. You can use trading platforms or software to see how it would have performed. This helps refine your strategy.
What are some common Moving Average combinations used in crossover strategies?
Traders often use the 5-10, 10-20, 20-50, 50-100, and 50-200 period averages. The right combination depends on your strategy and the market you’re watching.
 Backtest Your Trading Strategy