Summarize at:
The state of rest and activity is a global concept in any research, from theoretical physics to the world economy.
The proposed indicator evaluates the strength of the trend method by deviating from some average value. Of course, a strong price pulse can be seen without additional tools, but whether there will be a strong trend after, that is difficult to understand.
As a rule, prices do not usually deviate far from the equilibrium zone in any of the parties. But if such a fact happens, you can already talk about the chances of a reversal and a change in the nature of the market and here Standard Deviation can come in handy.
Let’s look at it in detail.
Standard Deviation: Logic and purpose
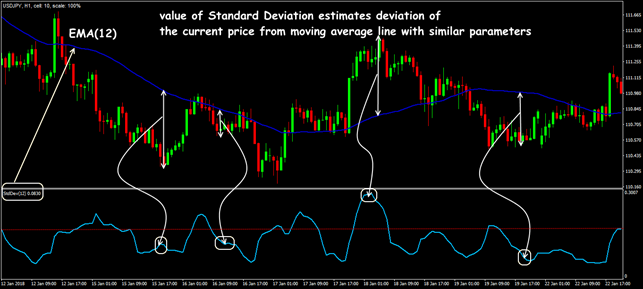
Standard Deviation is not so much an indicator as a function of the standard price deviation. The idea is that the market is considered to be volatile if the price is actively changing relatively to some average value, for which the corresponding moving average is chosen in Standard Deviation. If the market is in a flat, then the bars prices are fairly close to the moving average, and volatility is considered low (see Standard Deviation − Explained and Visualized).
Interpretation of indicator readings is standard:
- if the value is too low, then the market is in the flat and there may be a sharp increase in activity;
- if the value is extremely high − the market is preparing to return to a state of rest;
- prices between the lower and upper limits of the Standard Deviation indicator are considered to be the equilibrium zone.
It is assumed that the price fluctuates relatively to the moving average as around the axis of rotation, but as far as this corresponds to reality − a controversial issue.
So let’s begin.
Standard Deviation: Calculation procedure
Calculation of the values of Standard Deviation can be found in the theory of statistics and applied to current prices:
where:
StdDev(i) − Standard Deviation from the current candle;
n − period of smoothing;
ApPRICE (i-n) − price used for bar with the corresponding number;
Apprice (i) − price used for the current candle bar;
SMA (apPRICE (i), n, i) − any moving average of the current bar for n periods.
Absolute value of the indicator is not used, we analyze only the overall dynamics of the line.
Standard Deviation: Parameters and control
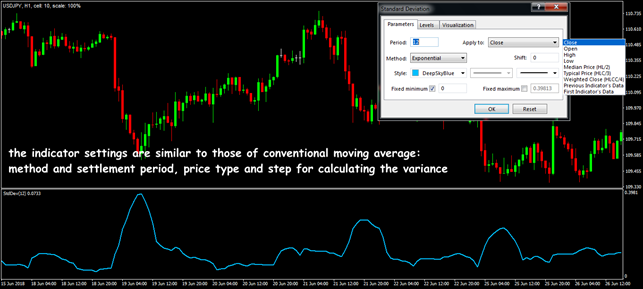
The indicator line is located below the price chart in an additional window with a dynamic scale. Level lines and balance, as well as the offset parameter are not used. It is recommended that you use the price type and the default settlement method.
To select the calculation period (in bars) we use the logic customary for moving averages, taking into account the time of transaction.
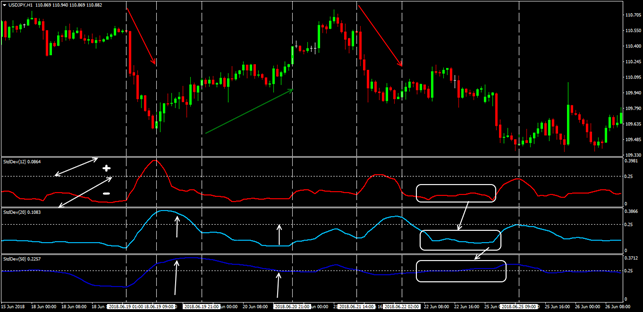
Too small value will show short-term volatility, on which any speculation will actively distort the overall picture. For medium-term items, parameter needs to be increased.
Negative and positive zone can be defined conditionally (above/below a certain level) − so it will be more convenient to analyze dynamics.
With increase in the calculation period, line is gradually adjusted and shifted depending on long-term volatility.
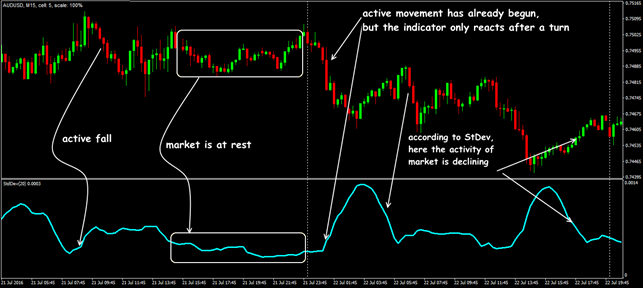
A typical delay for the moving average leads to a fact that the line of Standard Deviation indicator shows a decrease in market activity, even if the price continues to move confidently in the main direction.
What this means is, it is possible to assess the commercial value of StDev only qualitatively.
Trade signals of the Standard Deviation: indicator
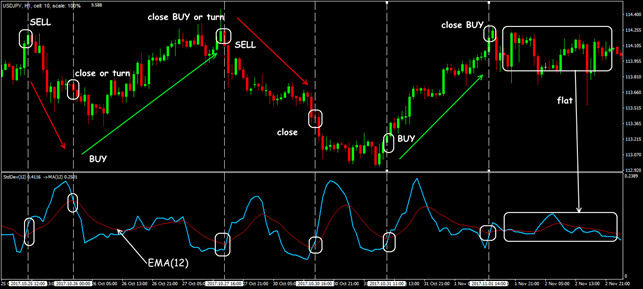
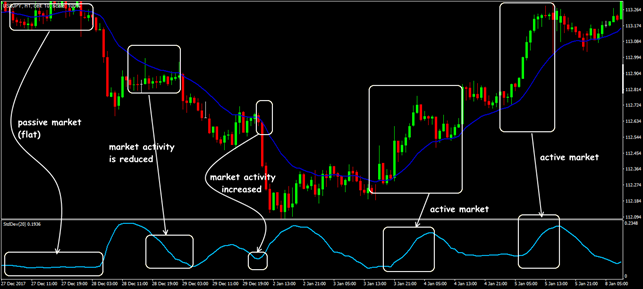
The logic of Standard Deviation suggests that the stronger is the trend, the greater is the indicator value, if the market is inactive, then the indicator should move near zero.
In the moment of activity, the line rises regardless of whether bull or bear is the underlying trend − this indicates opening of positions by market participants.
The market «crowd» sees that the asset has become much cheaper (or more expensive) of its fair value and begins to buy (or sell) it.
At the time of a new trend formation, the indicator line breaks through its extremums and the faster it grows, the stronger the subsequent price movement will be. The rollback of the line from the maximum values means a decline in volatility (market activity is declining).
The small values of the indicator StDev characterize the market as passive (flat), that is, it is necessary to wait for a breakthrough in any direction. This is understandable − prices are beginning to seek a moving average, it means that the market either begins consolidation, or is preparing a turn.
Both options create additional risks, so it’s better to fix the positions, or at least tighten Stop Loss closer to the current price.
What result do we have?
The search for trends using such simple statistics is a rather unreliable way to estimate volatility, therefore the Standard Deviation indicator is most often used to find additional entry points in the direction of a stable trend. In this case, the trend, as a rule, is tested by more classical methods.
Implementation in Standard Deviation trade strategies
In practice, you should pay attention only to serious deviations from average prices, the value of which is estimated on the history (this level can be set in the indicator window as a balance line).
You can also use SMA, built on the values Standard Deviation, as a balance line, (see here Standard Deviation Strategy).
The strategy for trading on rollbacks involves buying and selling an asset after reaching StDev of its extreme value. Briefly, the rules can be formulated as follows:
- if the trend is bullish and Standard Deviation breaks the border of its «normal corridor» when the price decreases (correction of the uptrend) − we buy the asset;
- if trend is bearish, but the indicator line goes beyond the «normal range» with a simultaneous rise in price (correction of a downtrend) − open deals for sale.
It is believed that the equilibrium zone is between the lower and upper limits of the Standard Deviation indicator; the top line is resistance, and the bottom line is support.
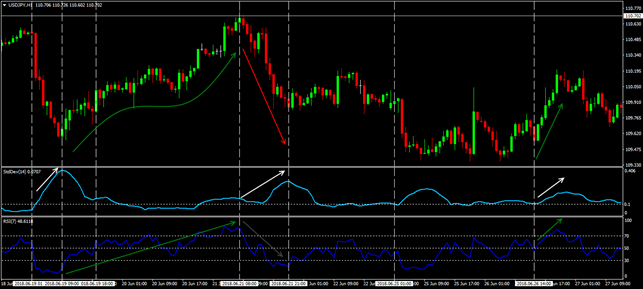
The indicator can be used as a trend filter in a strategy with oscillators − in case of breakdown of the line flat, the transaction opens in the direction of the trend. For example, in the StDev+RSI system, the trend indicator will be StDev, and the trading signal − RSI indicators in the direction of Standard Deviation.
Stable systems are obtained in combination with other trend indicators, for example, MACD.
MACD will confirm the trend and show traditionally strong reversal signals, and Standard Deviation increases the reliability of signal to input, taking into account the volatility growth.
Several practical remarks
The Standard Deviation indicator is considered «omnivorous» − the accuracy of its operation on any asset is approximately the same. But if you try to use StDev for solving tasks that are unusual for it, then problems cannot be avoided.
Today trends begin with a price pulse too often − and Standard Deviation reacts actively, but really strong, confident trends are formed precisely in the market with moderate (quiet) volatility. And then the proposed indicator is ineffective.
We remind: volatility never shows the direction of the trend, and Standard Deviation only visually assesses how strong is this or that trend.
Alone, the StDev indicator is not used, only complete with classic trend tools. More often it is used to find entry points into an already identified trend.
Simply download Forex Tester for free. In addition, you will receive 23 years of free historical data (easily downloadable straight from the software).
 Backtest on Forex Tester Online
 ไทย
ไทย
 Tiếng Việt
 Polski
 Türkçe
 Nederlands
 Română
 한국어
한국어
 Svenska

