Summarize at:
Visual analysis gives triangle price models a special meaning. It is in the shape of Triangle that any adjustments occur, in the consolidation period the market volume accumulates inside of it, and the pattern borders test warns about an upcoming leap.
The model has various options, appears on any assets, timeframes and volumes, has enviable durability and easily recovers after gaps and speculative leaps.
Chances for workout of all the Triangle schemes are very high, so let’s begin.
Technical parameters of the pattern
The triangle is a graphic model of two bearing lines along the local max/min row, 2-3 on each side. Borders are considered dynamic support/resistance lines. They are considered working after at least two touches and must cross in perspective.
Only in a divergent Triangle such a point is located in the ‘past’, that is on the left from the actual price, for the others — on the right (in the future).
A trade signal is the breakthrough of the upper and lower border. Let’s look at it in detail.
In theory, the market must do at least 5 full fluctuations in the model zone, and the common number of waves in the Triangle must be uncountable. Models on the period no lower than H1 are considered stable.
Possible goals for a profit:
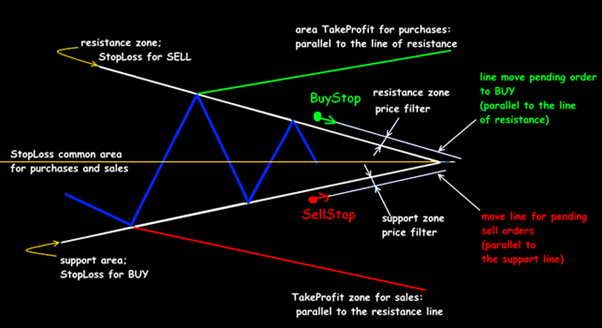
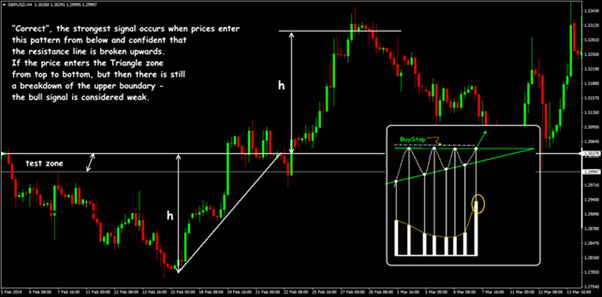
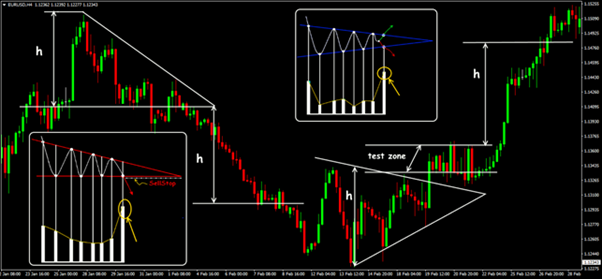
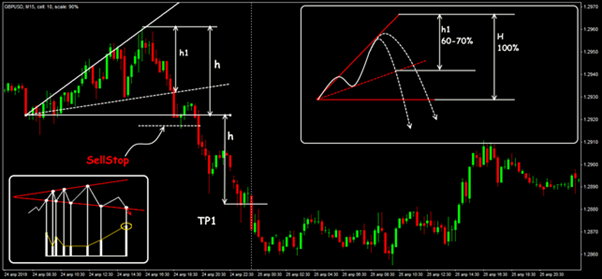
- either the height of the model (the widest part of the pattern) is postponed from the point of breakthrough;
- or two lines: parallel to the support — across the upper point (with a breakthrough upwards), parallel to the support — across the lower point (for a breakthrough downwards).
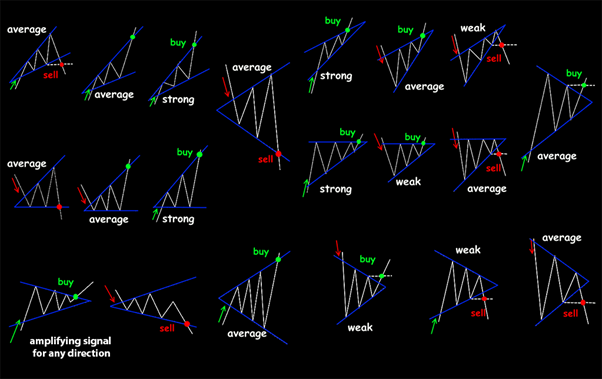
The power of a signal depends of mutual placement of the model as a whole and the direction of a breakthrough. After the breakthrough, the pattern border change its market value, and the price is “entitled“ to make a kickback from the new level before the new trend.
In process of approaching the crossing point of the lines, the amplitude of fluctuations inside the model goes down, but trading volumes accumulate for a breakthrough.
The power of a trading signal depends on the entry direction into the pattern and the breakthrough direction.
Pattern implementation examples
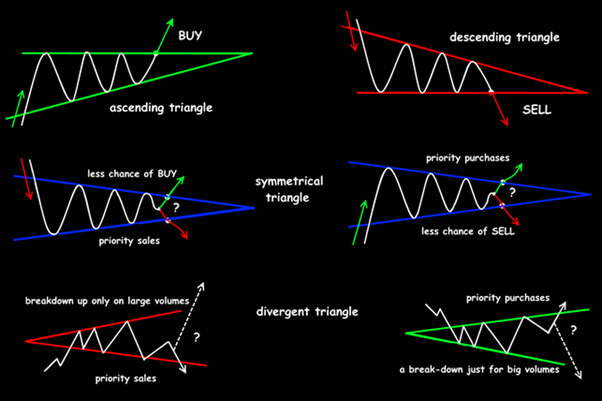
Ascending (Bullish) Triangle
The model consists of a horizontal resistance level (on top) and sequentially ‘growing‘ minimums.
It is expected that a bullish trend already exists at the market, but the buyers can’t overcome the local resistance for now (usually, a zone of failed test is visible). The pattern is taken as a consolidation model before the following rise.
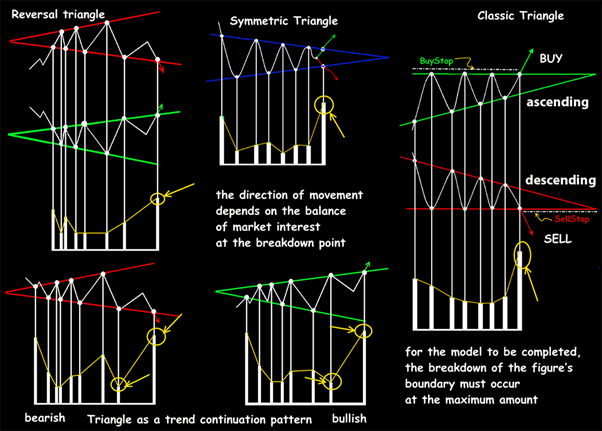
The upper border is penetrated the most often — above it pending orders for buy are set.
There are situations when a upgoing Triangle is formed as an adjustment on a downward trend. Then a middle signal for sale emerges after the price entry into the pattern zone at the top and a breakthrough downwards the inclined border.
Descending (bearish) Triangle
Lower border of the figure — horizontal zone (at the first approach), upper border — sequentially ‘falling’ maximums.
The bearish trend is present at the market, but sellers can’t break through its zone of support and pass further. In expectation of the penetration below the lower border, pending sale orders are set.
If the price enters the pattern from down up, but as a result it goes down anyway — the signal for sale is considered weak.
If the downward Triangle is formed on a strong bullish trend and the price enters the zone of the model from down up, then a bullish penetration of the inclined border is more likely — the middle buy signal.
Convergent (symmetrical) Triangle
It is two crossing (theoretically, of course) lines of support/resistance.
Fading amplitude of fluctuations inside such pattern may lead to the penetration in any direction: this is an ordinary sequence of trent areas and flat periods.
The model is considered neutral, this means that usually two pending orders are placed — BuyStop (above the upper border) and SellStop (under the lower border).
The statistic shows that even on the upper trend the probability for a penetration of the entry directions into the pattern are much higher.
Divergent Triangle
The model seems inverted to a symmetrical Triangle, borders must be located at an angle equal to the horizon.
The pattern is being formed for rather long, local max/min, not reaching the borders, are possible inside the zone.
Fundamentally, it means the state of long uncertainty after a strong trend, when swing-traders start rocking the price, and then the model gradually expands at the cost of opening new positions.
What this means is that trading under such a Triangle is dangerous, a confident signal for the enter emerges only with a true penetration and consolidation behind the borders of the figure.
A small divergent Triangle is better to be skipped at all, a larger one may be traded at the retests of the borders, but private ‘fake’ penetrations are possible — strong news may well break this model at the moment of the price reaching the border.
It is recommended to combine the target levels with the Fibonacci level from the last movement.
A few practical remarks
The statistic shows that a penetration of the borders and a workout the pattern towards the initial trend are the most possible.
Penetration in one direction must be at the distance from ½ to ¾ length of the figure horizontally, otherwise the signal will be considered weak.
Signals of Triangles, as any graphic patterns, don’t give a 100% guarantee and require quite strict money management.It is necessary to check the model on senior timeframes.
Classic models are rarely formed at the real market, more often many ambiguous figures appear — as separate independent signals or/and as a part of larger patterns.
The result? Any shape failures decrease a probability for Triangles to work at the standard scheme, and it is left to estimate their strength by the direction of price waves which are a part of it.
The border can be penetrated as an ending of a strong impulse and then the signal may come as fake. For example, strong news may well break the model.
To enter, it is recommended to wait for the closure of the key candlestick which has penetrated the border — we enter toward the breakthrough only if the candlestick is closed behind the border. If the candle is closed inside the model, the penetration may be considered as fake.
One may trade inside the Triangle only with a wide (but not max!) amplitude of fluctuations. though such trading is not recommended for newcomers.
It is the Triangle shape that depicts the main feature of the market — ongoing battle between sellers and buyers and dynamic market balance, when both sides temporally can’t move the price in the desired direction.
Always watch the volumes (at least tick volumes): volume must decrease inside the model, and during the penetration — sharply increase.
Try It Yourself
As you can see, backtesting is quite simple activity in case if you have the right backtesting tools.
To check this (or any other) graphical analysis you can try Forex Tester Online for free.
In addition, you will receive 23 years of free historical data (easily downloadable straight from the software).
 Test this pattern on Forex Tester Online
 ไทย
ไทย
 Tiếng Việt
 Polski
 Türkçe
 Nederlands
 Română
 한국어
한국어
 Svenska
