Summarize at:
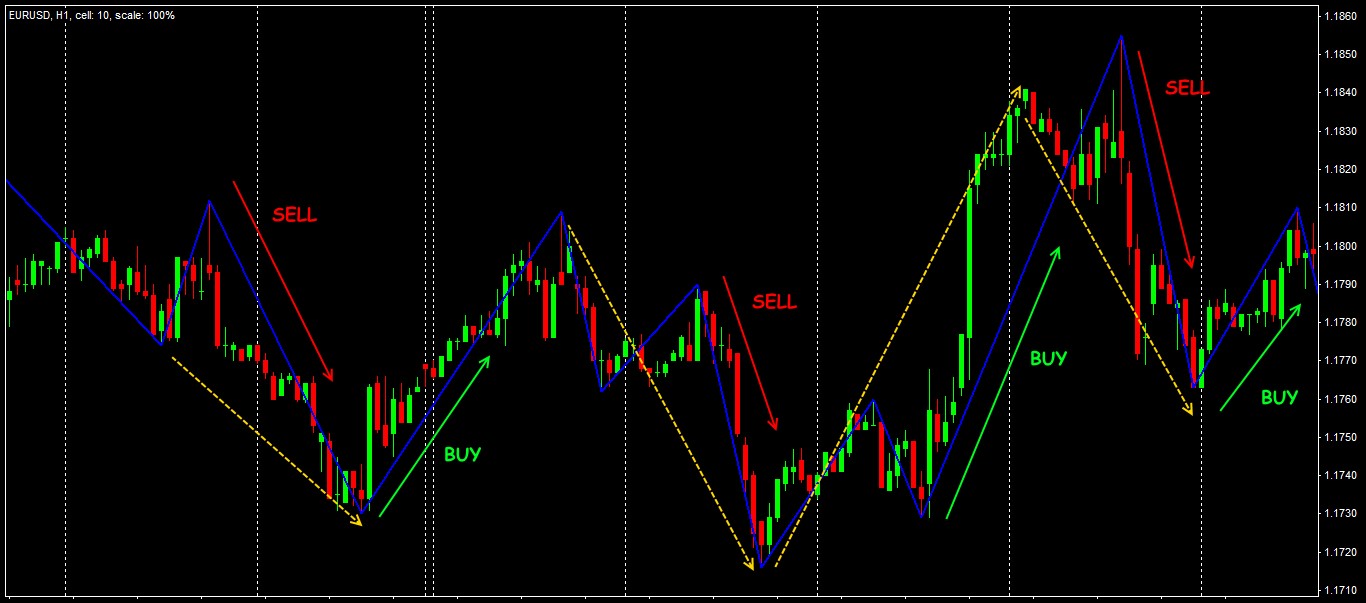
In fact, indicator ZigZag is a graphics filter to simplify the visual picture of the price movement. It does not modify the price data, performs a minimum of the mathematical calculations and is considered a signal tool for analyzing trend market.
Its key points are formed only with the strong price movements (above the set parameter), and small fluctuations are eliminated. This allows you to determine the main points of the turn and to identify the emerging graphics and wave structures; sections of trend movement connect significant extremes on the chart.
ZigZag enjoys a special appreciation among the enthusiasts of the wave trading.
Let us see exactly how this works.
Logic and purpose
The history hasn’t kept a name of the ZigZag indicator’s author (in a modern look), but his prototype, most likely, has appeared during the development of the wave analysis.
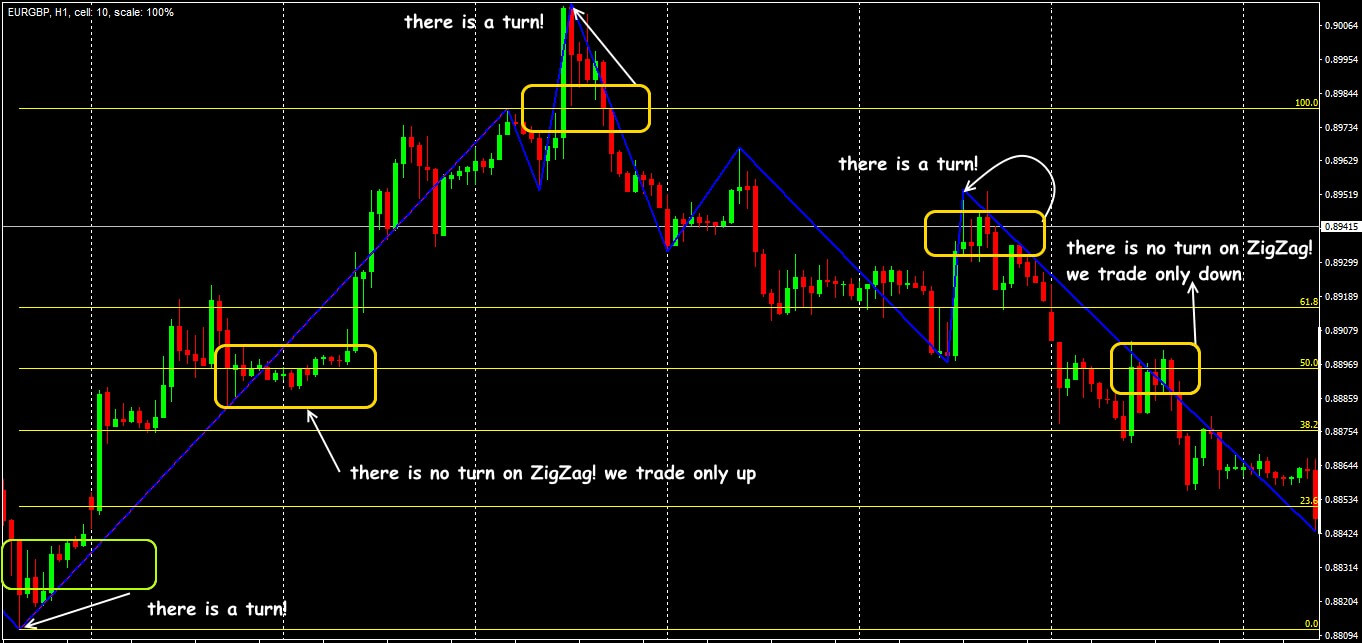
The main task of indicator is to reveal the trend sites on the price chart and to estimate the probability of a turn (or continuations).
While the calculation the most important extremes are filtered by the usual comparison of the current dynamics with the ZigZag parameters. ZigZag doesn’t predict the behavior of price in the future, and only indicates considerable changes in past – for this reason in its calculation prices Close are used. Indicator builds lines only according to actual data, the result of the graphical analysis looks like a broken trend figure on the price schedule.
Calculation procedure
If the movement of the price exceeds the established values, then on main schedule the corresponding extremes will be designated, otherwise ZigZag won’t pay attention to them. But if the indicator nevertheless has connected two extremes into a straight line, then this site of price schedule can be considered «confidently» trend.
For example, the calculation formula at first «looks for» price minimum corresponding to Depth parameter conditions (see below) and fixes it on the graphic. If the market continues to fall, then every time when the price falls by the step distance (parameter − Deviation) or more, a final point of the line will move below and below.
Trading signals of the indicator ZigZag
The local minimum will be updated until market conditions for a turn appear: the price has to go against the current direction by the step size. Then indicator ZigZag begins to look for a local maximum, at the same time it investigates period consisting of the candles set in Depth variable again.
In the case of success, indicator will create the new site of the broken line already against a trend, and the further − cycle is repeated (see Trading with ZigZag indicator).
From this point of view, we recall: indicator ZigZag allows «redrawing» entire graphic design with strong price rolls. The last (forming) section can change its direction and length depending on the current price changes. This can be a serious problem for short-term trading.
Parameters and control
The standard version of the indicator can be found in any trading platform, names of the parameters in different versions can differ, but three basic filters surely are present at settings.
They define what extremes the mechanism of calculation will consider significant and, respectively, to connect these sites trend lines ( see How To Use ZigZag indicator).
So the basic parameters are:
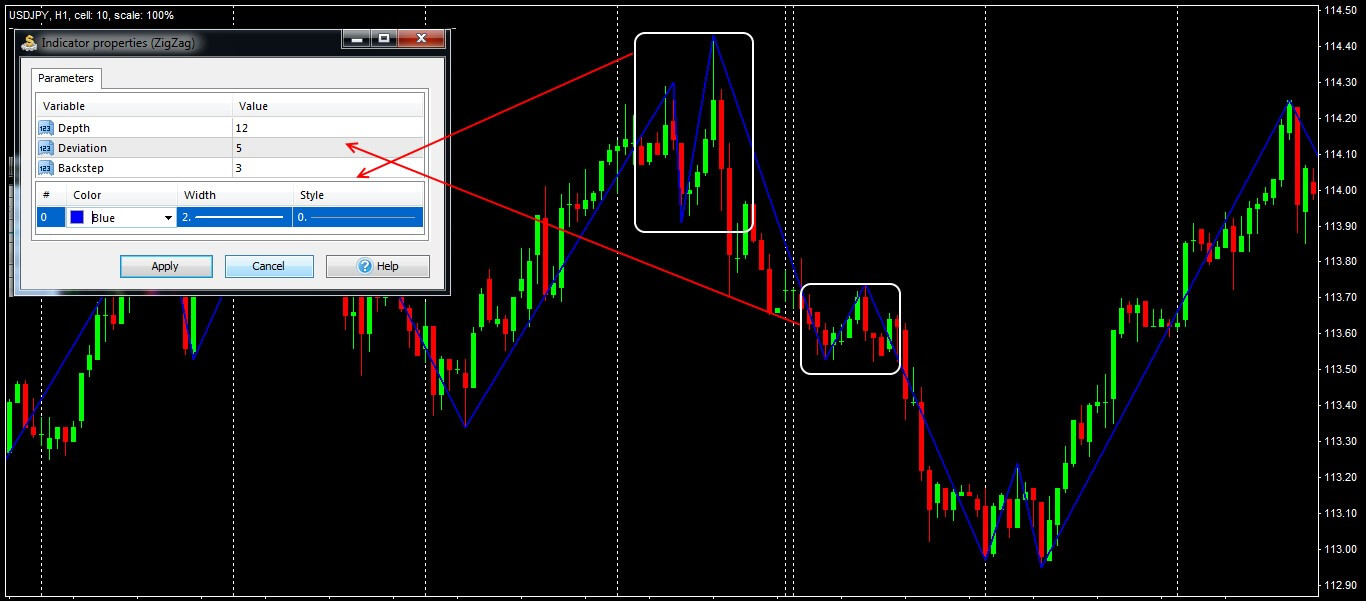
- Deviation (sometimes – ExtDeviation): the minimum quantity of the points (in % between min and max of two next bars) which is necessary for the formation of a new local extremum. All price movements above this value will be noted by the ZigZag line, and those that are less, − are ignored. In the majority of the trading platform versions 5% of the deviation are offered by default, values more than 10% make sense only for assets with non-standard volatility. Results of the graphic creation of the indicator depend on a timeframe.
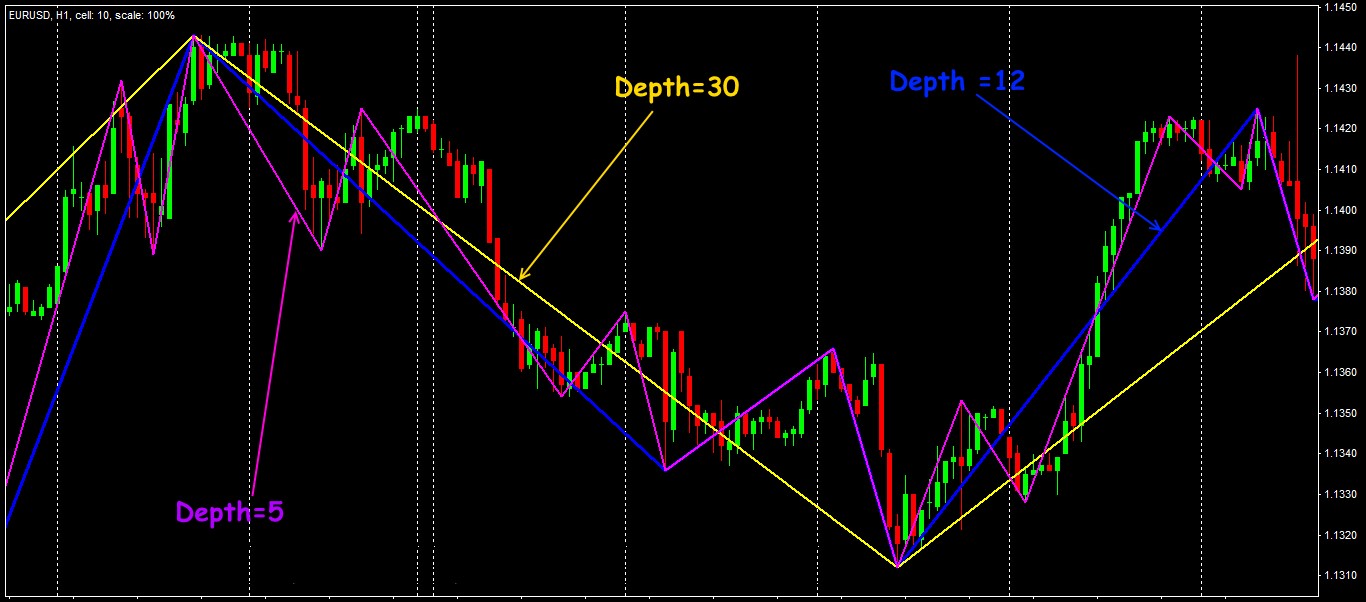
- Depth (ExtDepth): the minimum quantity of bars at which ZigZag won’t form a new extremum even if the condition for the Deviation parameter is satisfied. For example, if the value 10 is established, and the change in price has happened for 9 (bars), then the indicator simply «skips one step».
- Backstep: a minimum quantity of the bars between consecutive local max/min. If this condition isn’t satisfied, new extremum isn’t formed even if the first two parameters are met.
There are no strict rules for the choice of parameters, but, as a rule, settings are by default rather balanced, and are recommended for medium-term trade in the most popular assets.
Standard version of the ZigZag indicator
Key parameters for non-standard assets (or trade conditions) can be changed, but you shouldn’t be fond of the experiments too. Change of the basic values rather strongly influences the indicator’s degree of the sensitivity to movement of price.
If calculation parameters are too small, number of local max/min increases, indicator will build more small sections and make long trend line more «torn». As a result − a lot of «false» signals.
The long and short step of the ZigZag indicator
It is beneficial to use versions of the ZigZag with a different color for lines for bullish and bearish trends. Many modified versions can be found on the network, but more additional parameters indicator has, more difficult it is to identify its signals.
Let’s look at it in detail.
Trade indicator signals
Indicator ZigZag has a wide range of the applications, despite the fact that it does not provide traditional, explicit entry points.
So, you can …
-
- determine the direction of the trend and build trend line − through the extreme points (see Using Graphic Tools);
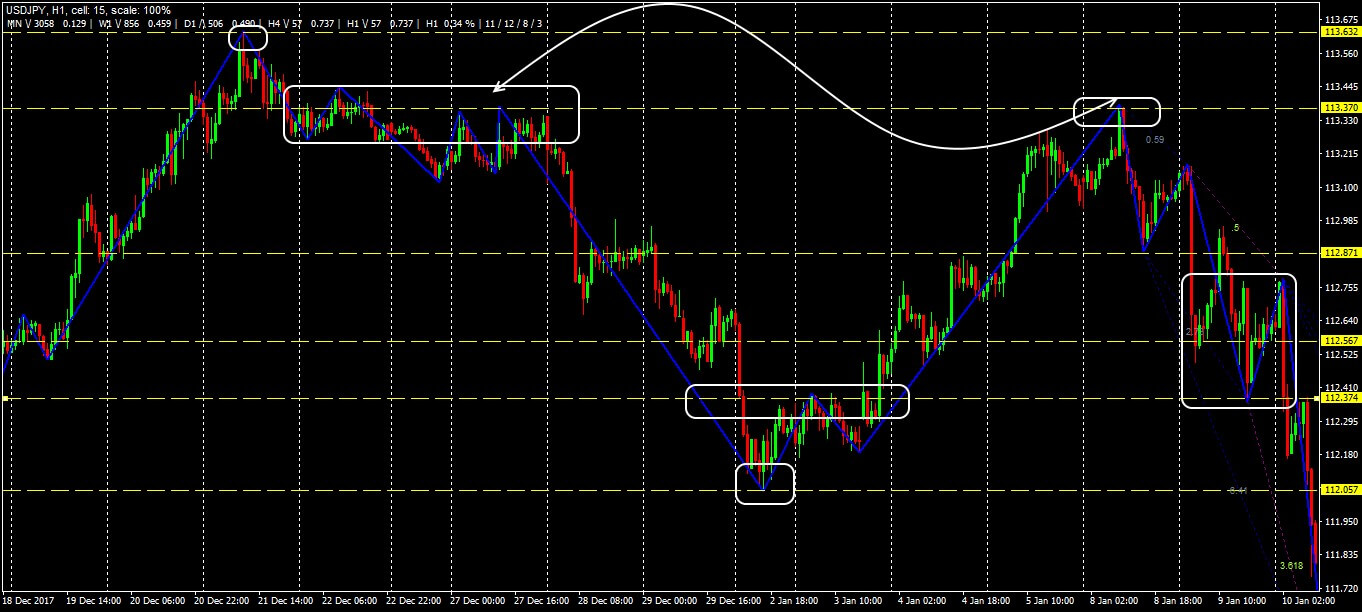
- see support/resistance levels;
ZigZag indicator on support/resistance levels
-
- estimate the depth of the possible correction and the Stop Loss levels (for example, using Fibonacci levels);
The scheme of the trading signals set Fibo+ZigZag
-
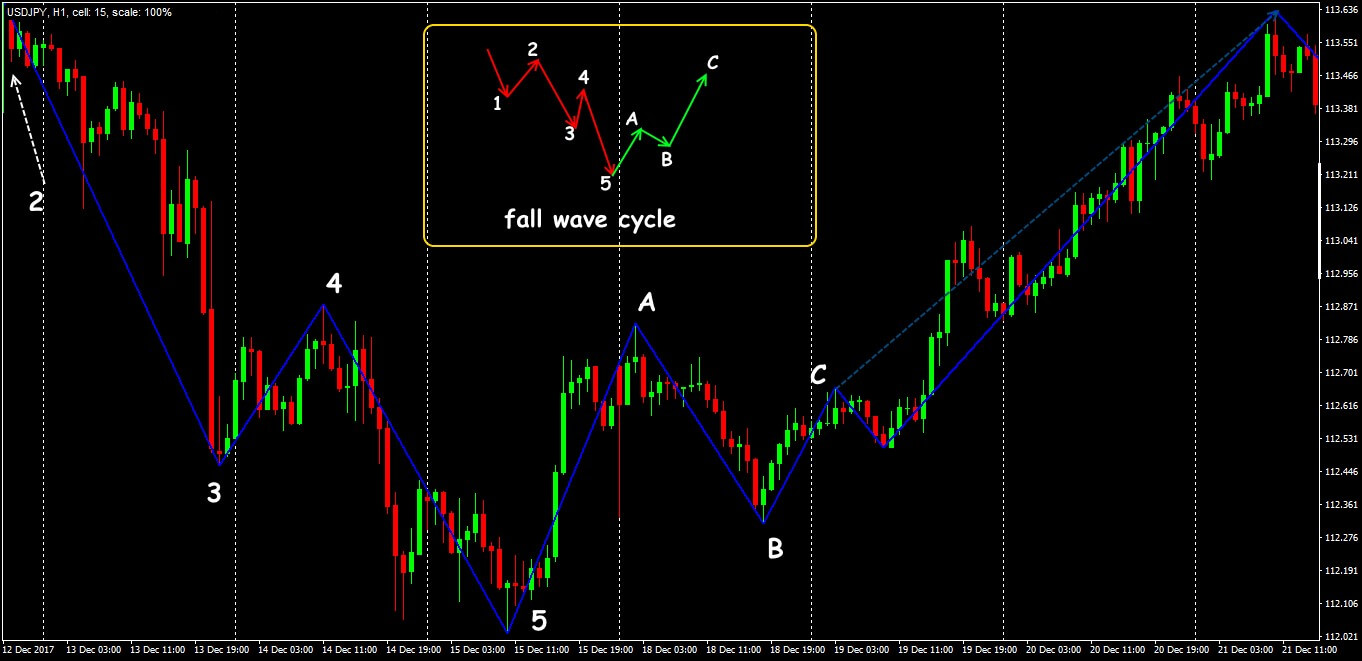
- perform wave analysis and corresponding graphical constructions;
ZigZag and wave patterns
-
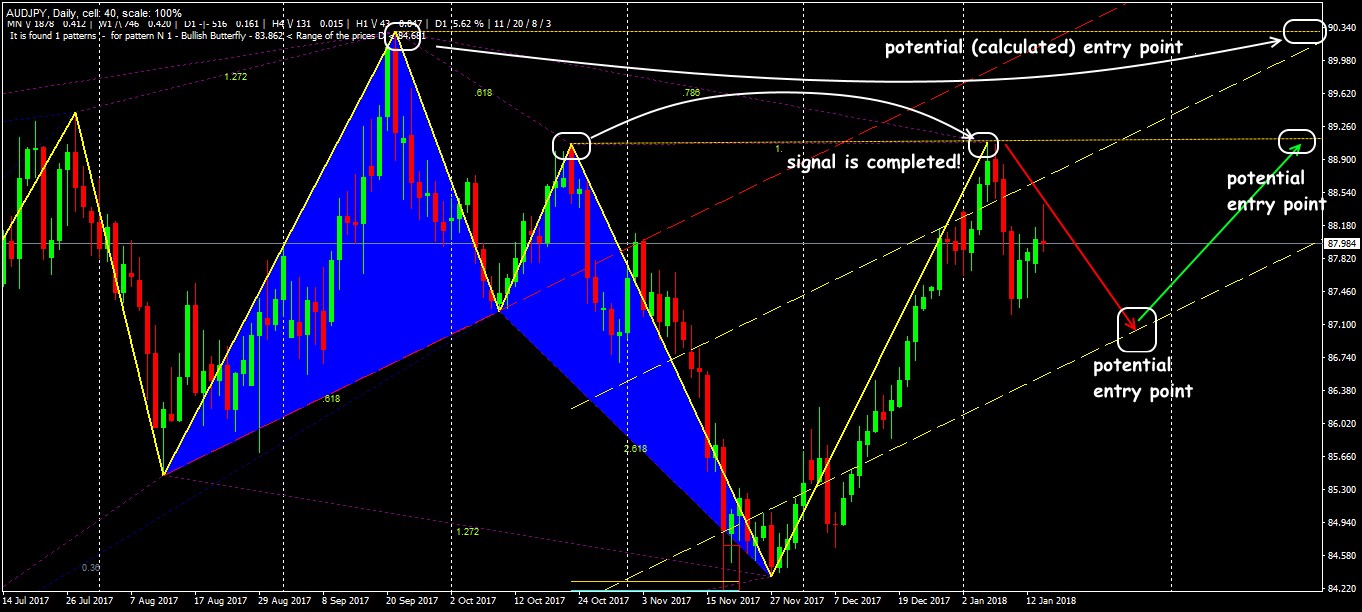
- identify the classical patterns on the price chart.
Classic «Butterfly Gartley» on ZigZag
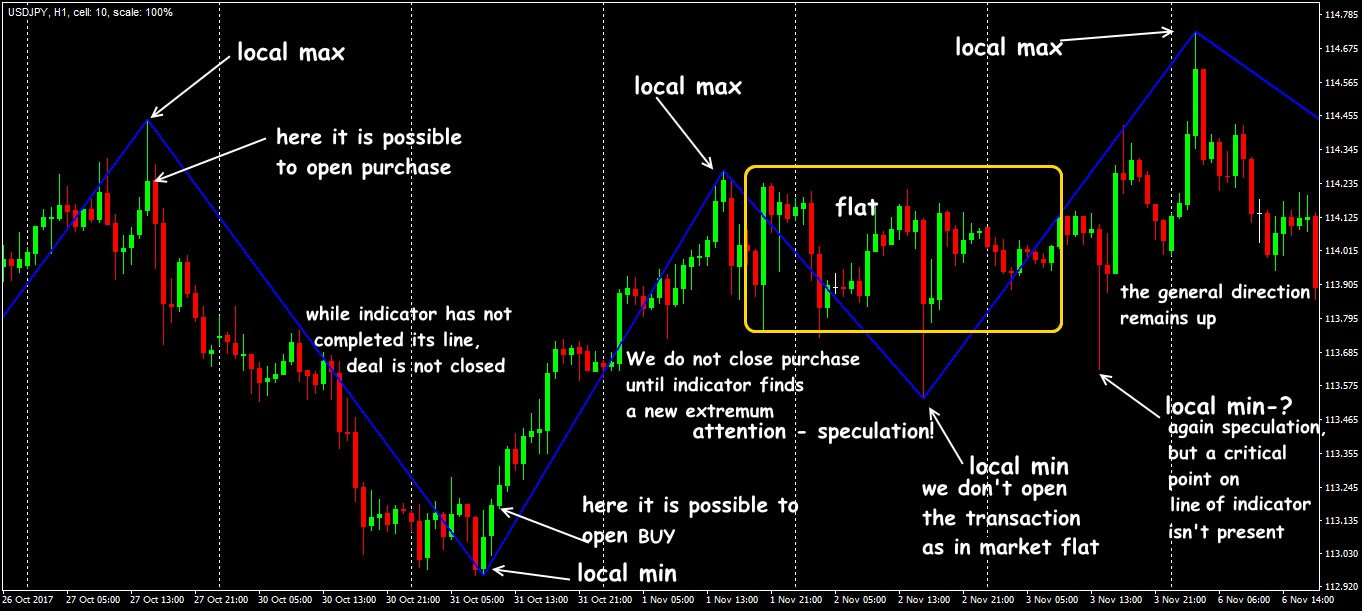
Please, keep in mind: the last (not completed) section of the ZigZag line is always in dynamics.
What this means is:
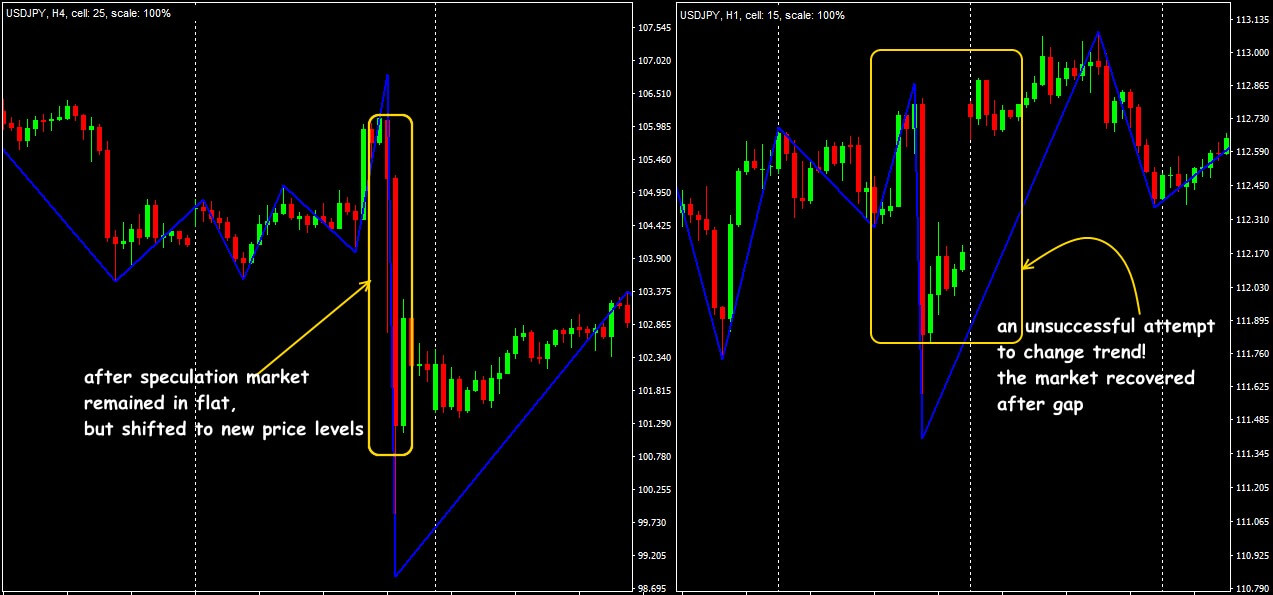
The position of the endpoint is constantly changing until the indicator’s mechanism «decides» that a new extreme has formed. It is necessary to take into account the market activity − speculative movements can break down a graphic design, therefore, news periods or other fundamental events require a special attention.
The main logic of the ZigZag indicator
Application in trade strategy
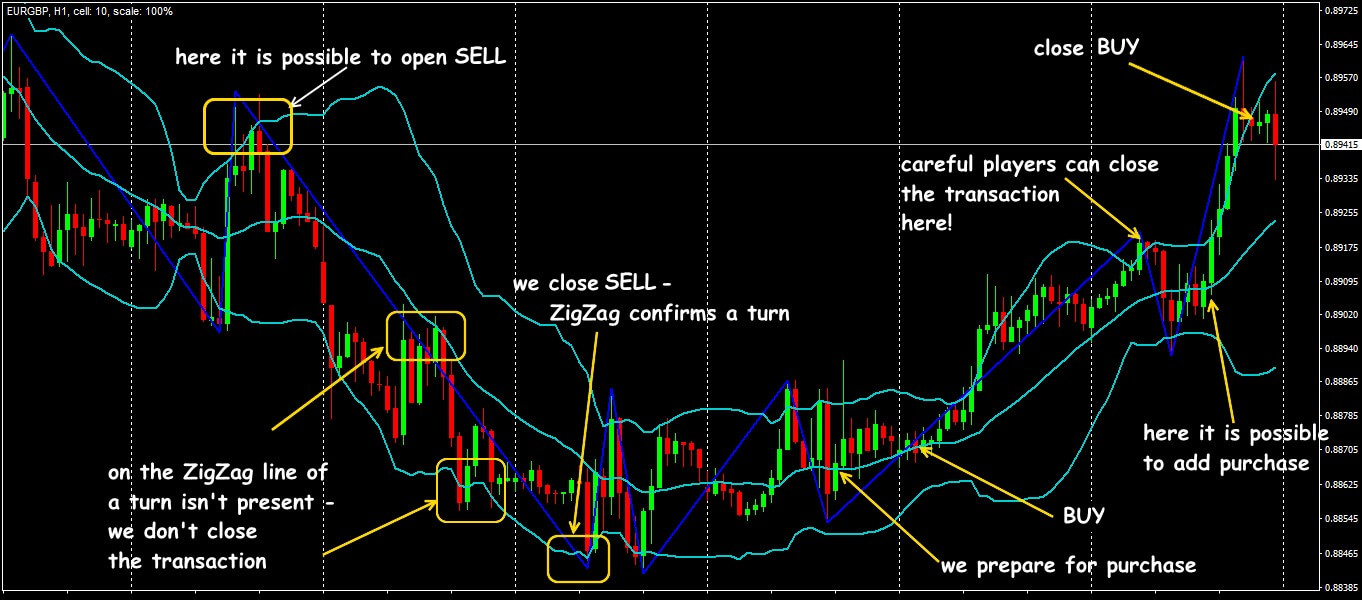
In the trend strategies, the ZigZag is always used as a trend definition tool, so it works fine with the price channel indicators such as Bollinger Bands:
ZigZag+BB: trading signals
Here you can see one more working option: ZigZag indicator − Pattern breakout strategy
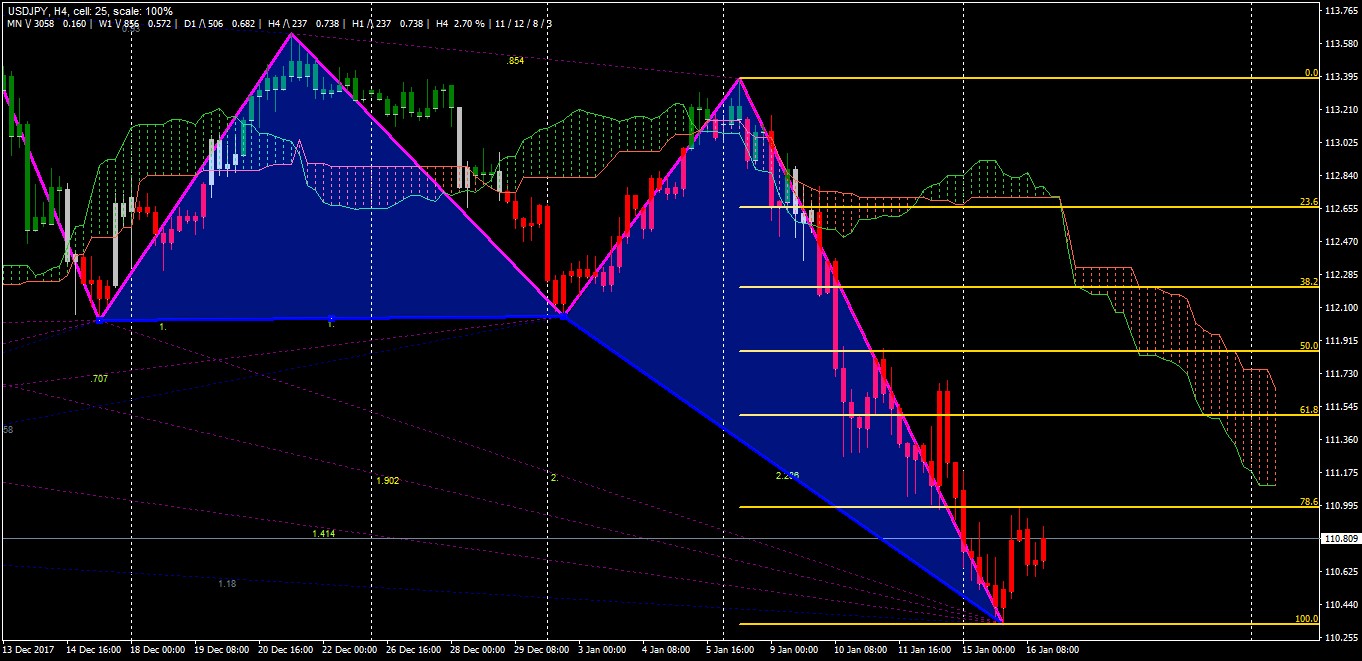
A reliable set of ZigZag+Kumo+Fibo
Another effective example of a strategy using the Renko technology: Trading With ZigZag Patterns Renko.
Several practical remarks
Indicator ZigZag cannot create a complete trading system: it does not give explicit trading signals, does not make forecasts, and does not participate in the search for opening/closing signals.
This information helps to choose the direction of the transaction and establish optimal Stop Loss, which steadily saves a trader from possible losses. A different application of the indicator conflicts with the main calculation mechanism, so it is recommended only on timeframes from H1 and higher.
ZigZag: examples of the specs
The indicator guarantees approximately the same accuracy on any trading asset, but we should remind that its calculation does not use smoothing or averaging mechanisms.
Result?
Is that any price shots cause an incorrect response and «break» ZigZag lines, that is, its information cannot be trusted during periods of a speculative market.
ZigZag is an effective tool for assessing the current market position and well complements any trading strategy. Thanks to it, a trader will not be distracted by small price fluctuations and will not miss the global reversal. It is recommended use actively for both the beginners and professional traders.
Try It Yourself
After all the sides of the indicator were revealed, it is right the time for you to try either it will become your tool #1 for trading.
In order to try the indicator performance alone or in the combination with other ones, you can use FTO with the historical data that comes along with the program.
Simply start using Forex Tester Online. In addition, you will receive 23 years of free historical data.
Share your personal experience of the effective use of the indicator ZigZag. This article was useful to you? It is important to us to know your opinion.
 Backtest on Forex Tester Online
 ไทย
ไทย
 Tiếng Việt
 Polski
 Türkçe
 Nederlands
 Română
 한국어
한국어
 Svenska
