The history of Accumulation/Distribution indicator contains elements of randomness and humor − its author, the famous Marс Chaikin, was forced to engage in creative research by an elementary shortage of information. As a result, several well-known figures of the market were involved in the process.
At some point, the daily financial publications stopped publishing market opening prices, and Chaikin could not use Larry Williams’s accumulation index (WAD) or Joe Granville’s On Balance Volume indicator.
As a result, he simply replaced the opening price in the Williams formula by the mid-range price. The experiment turned out to be successful and later became the basis for the original Chaikin Oscillator.
Initially, the A/D indicator was created to measure the cash flow that is sent to the shares, but today it is actively used in both the stock and the currency market to confirm price changes by measuring the relevant trading volume.
We also need it − Let’s look at it in detail.
Accumulation/Distribution indicator: Logic and purpose
Accumulation/Distribution operates a standard market idea that during the periods of a bullish trend, most of the closing prices are in the zone of the current timeframe maximums, and in the downward market − in the minima zone.
We remind: under the accumulation, we mean buying up assets by large players before the onset of a strong bullish trend. Distribution refers to the process of closing positions at the peak of the up market.
In the process of strengthening the trend, both the number of participants and the volume of transactions are growing. On the downtrend, the opposite situation is assumed, but even then the price movement downwards is accompanied by an increase in the tick volume (see AD).
This allows Accumulation/Distribution to determine the ability of bulls and bears to close prices on extremes, taking into account their trading volume.
The volume acts as a weight factor when the price changes − the higher is the ratio (volume), the greater is the contribution of price changes (over a given time period) to the value of the indicator.
Since there are no data on real market volumes in the Forex terminal, the tick volume is used in the calculation (see Volume indicator), which shows only the information on the number of changes in the price per unit of time. The more changes in price (ticks), the more weight they have in the final value of A/D.
To check this (or any other) strategy’s performance you can:
Accumulation/Distribution indicator: Calculation procedure
By calculation and behavior, the Accumulation/Distribution indicator resembles exponential moving averages (EMA): each subsequent value is added to the previous one, and the previous one is the sum of the remaining elements.
Basic calculation formula: A/D(i)=((CL(i)-Low(i))-(High(i)-CL(i)))*VOL(i)/(High(i)-Low(i))+A/D(i-1) where: A/D(i) is the indicator value; CL(i) − the closing price; Low(i) − the price is minimal; High(i) − the price is the maximum; VOL (i) − volume; A/D(i-1) is the previous value of the indicator.
Note the additional conditions in the calculation:
- If the closing price is at level of local price max, the final value of the indicator will be (+1)*(Tick Volume). If the closing occurs on min, then the formula takes the form (-1)*(Tick Volume).
- Closing above the middle and closer to the max: the value of the volume is multiplied by a positive number from the range [0; 1]. If lower − to multiply a number in the range [(-1); 0] is used.
- Close exactly in the middle of the range − the indicator is zero.
The A/D index accumulates the difference in volumes by the days when the closing price of the current day was higher than the previous day (accumulation) and the days when it was lower (distribution), and thus determines the balance between sellers and buyers.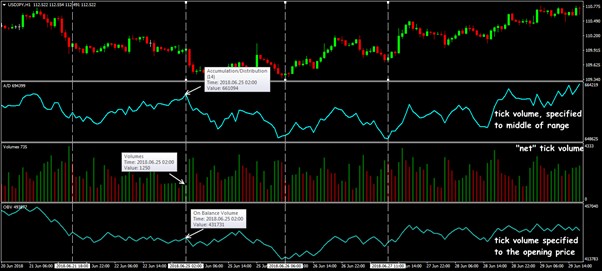
A/D, Volume, OBV: we work with teak volume
The sign (+) or (-) of the A / D indicator depends on the direction of the closed bar − rise or fall. The closer the closing price to the corresponding price extremum (that is, in the BullBar to max, in the BearBar to min), the larger is the proportion of volume gets the dominant is the group of participants.
If A/D is positive − in this timeframe the bulls are leading; if A / D is negative − bears were stronger.
The calculation technique does not use the averaging mechanism, so the indicator line moves synchronously with the price, and sometimes is ahead of it.
Accumulation/Distribution indicator: Parameters and control
The indicator is a traditional oscillator line in an additional window below the price chart. Like all teak volume technical tools, Accumulation/Distribution does not have any parameters, except for the graphic scheme. The indicator works with absolute values, so the level lines are also not used.
Standard version of the indicator A/D
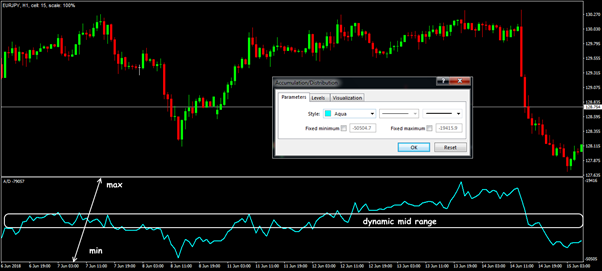
To make a decision, the dynamic of the indicator line is measured relative to the middle of the current range: higher/lower, active/passive.
To facilitate visual analysis, you can use SMA or EMA, which use the calculations of the A/D indicator results.
This highlights the dominant trend and allows you to see the potential reversal point much earlier than the price schedule will tell us.
Trade signals of the Accumulation/Distribution indicator
We remind:
There are no explicit outlets for Accumulation/Distribution, and the correct qualitative interpretation of its signals comes only with practical experience.
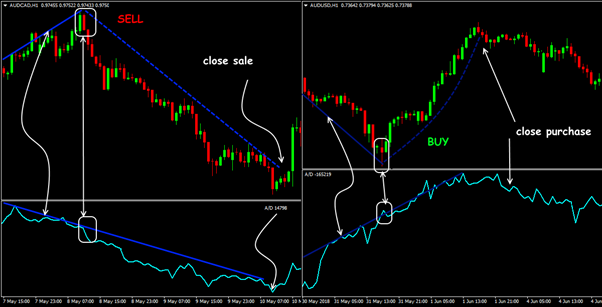
The main «useful for trade» indicator is the direction of the A/D line: growth means predominance of purchases, that is, the main trade volume is supplied to the market by «bulls».
If the line decreases, then the main volume of transactions is connected with sales and it is worth waiting for the price fall.
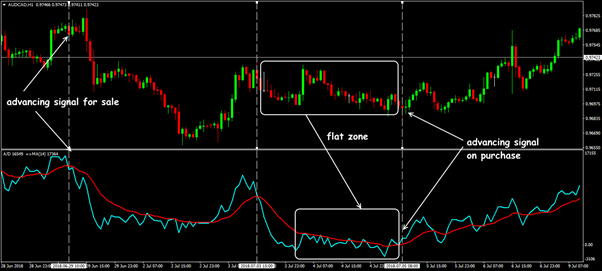
Classical signals of A/D indicator
We especially note that the indicator gives an unexpectedly strong signal in situations of divergence. This is understandable — trade volumes most accurately reflect the loss of interest in the current direction.
The problem is that such situations are quite rare, and to see them, you need some practical experience.
Tick data can show a divergence with a price only on timeframes from H1 and higher, and for most beginners such periods are unusual.
All divergences are processed according to the standard scheme − the direction of the price changes in accordance with the indicator line.
Accumulation/Distribution indicator: Application in trade strategy
The indicator can be useful in the following cases:
- the trend confirmation: an upward trend should be accompanied by an increase in the A/D line, bearish — with a decrease;
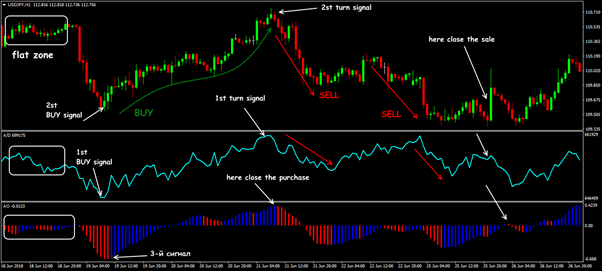
- search for graphic patterns: on the indicator line (with advance!) you can see «Triangle», «Double Top-Bottom» or, for example, breakdown MA or trend line on A/D — only turn signals are of interest;
- divergence: bullish — opens only deals for sale, bearish — deals for purchase.
Accumulation/Distribution complete with AO
What this means is in most situations, the A/D indicator is used as a normal oscillator. Today, in trading systems A/D is most often used as a trend filter, and Stop Loss in such cases are located behind the latest local extremes (see here Accumulation Distribution Indicator for Accurate Trend Trading).
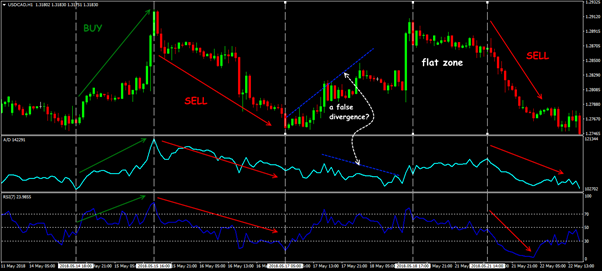
Accumulation/Distribution complete with RSI
For example, we recommend the RSI+A/D bundle: both indicators do not have an averaging mechanism in their calculation, and such a system gives signals as quickly as possible.
Accumulation/Distribution indicator: Several practical remarks
The main problem of the indicator is the incorrect accounting of price gaps.
We remind: Accumulation/Distribution works with tick volumes, which do not correspond to real market volumes of money. Several large deals on the tick chart are not visible, but quietly break the price trend.
If, for example, an asset at the market opening shows a gap up and closes in the middle of the max-min range, then the indicator generally «does not notice» the price gap.
A few gaps in a row (which happens all the time on futures assets) cause a significant error in the calculations and the A/D signals lose their trading sense.
Most of the market time, the indicator line moves synchronously with the closing price, which leads to a miss of divergence moments. A thin market with small volumes causes a strong lag of the indicator, especially on a weak trend.
What result do we have? A/D is not suitable as a separate tool for making a trading decision, but the indicator will be useful as an additional reference to all who understand the internal structure of the market.
 Try Forex Tester Online
 ไทย
ไทย
 Tiếng Việt
 Polski
 Türkçe
 Nederlands
 Română
 한국어
한국어
 Svenska
